Revamping Map Feature : Leveraging Existing Research Data with Cost and Technology Constraints
Revamping Map Feature : Leveraging Existing Research Data with Cost and Technology Constraints
Revamping Map Feature : Leveraging Existing Research Data with Cost and Technology Constraints
Open at desktop for better experience
Open at desktop for better experience
Role
Role
Role :
UI/UX Designer
UI/UX Designer
UI/UX Designer
Platform
Platform
Platform :
Android & IOS
Android & IOS
Android & IOS
Timeline
Timeline
Timeline :
May - August
May - August
May - August
What have I done, specifically
What have I done, specifically
What have I done, specifically
This is a small improvement, so I am solo product designer. I conducted desk research, analyzed previous research findings, collaborated with the development team, and sought input from my team. I created Hi-Fi designs and detailed interactions, deliverables, and measurements.
This is a small improvement, so I am solo product designer. I conducted desk research, analyzed previous research findings, collaborated with the development team, and sought input from my team. I created Hi-Fi designs and detailed interactions, deliverables, and measurements.
This is a small improvement, so I am solo product designer. I conducted desk research, analyzed previous research findings, collaborated with the development team, and sought input from my team. I created Hi-Fi designs and detailed interactions, deliverables, and measurements.
Background
Background
Background
ViuiT is an on-demand service application that offers various services such as food delivery, transportation, parcel delivery, and shopping, with additional social media features that make it fun and interactive for users to make food or product purchases. Currently, ViuiT has successfully operated in several cities in East Java and has thousands of loyal users.
As a delivery app, the map or "Map" feature is crucial in the ordering process as it helps users pick locations accurately. However, during the initial launch, ViuiT had business challenges and project time constraints that made the performance of the map feature, unlike the standard usage of maps. This resulted became challenges in the user experience.
Problem Challenges
Problem Challenges
Problem Challenges
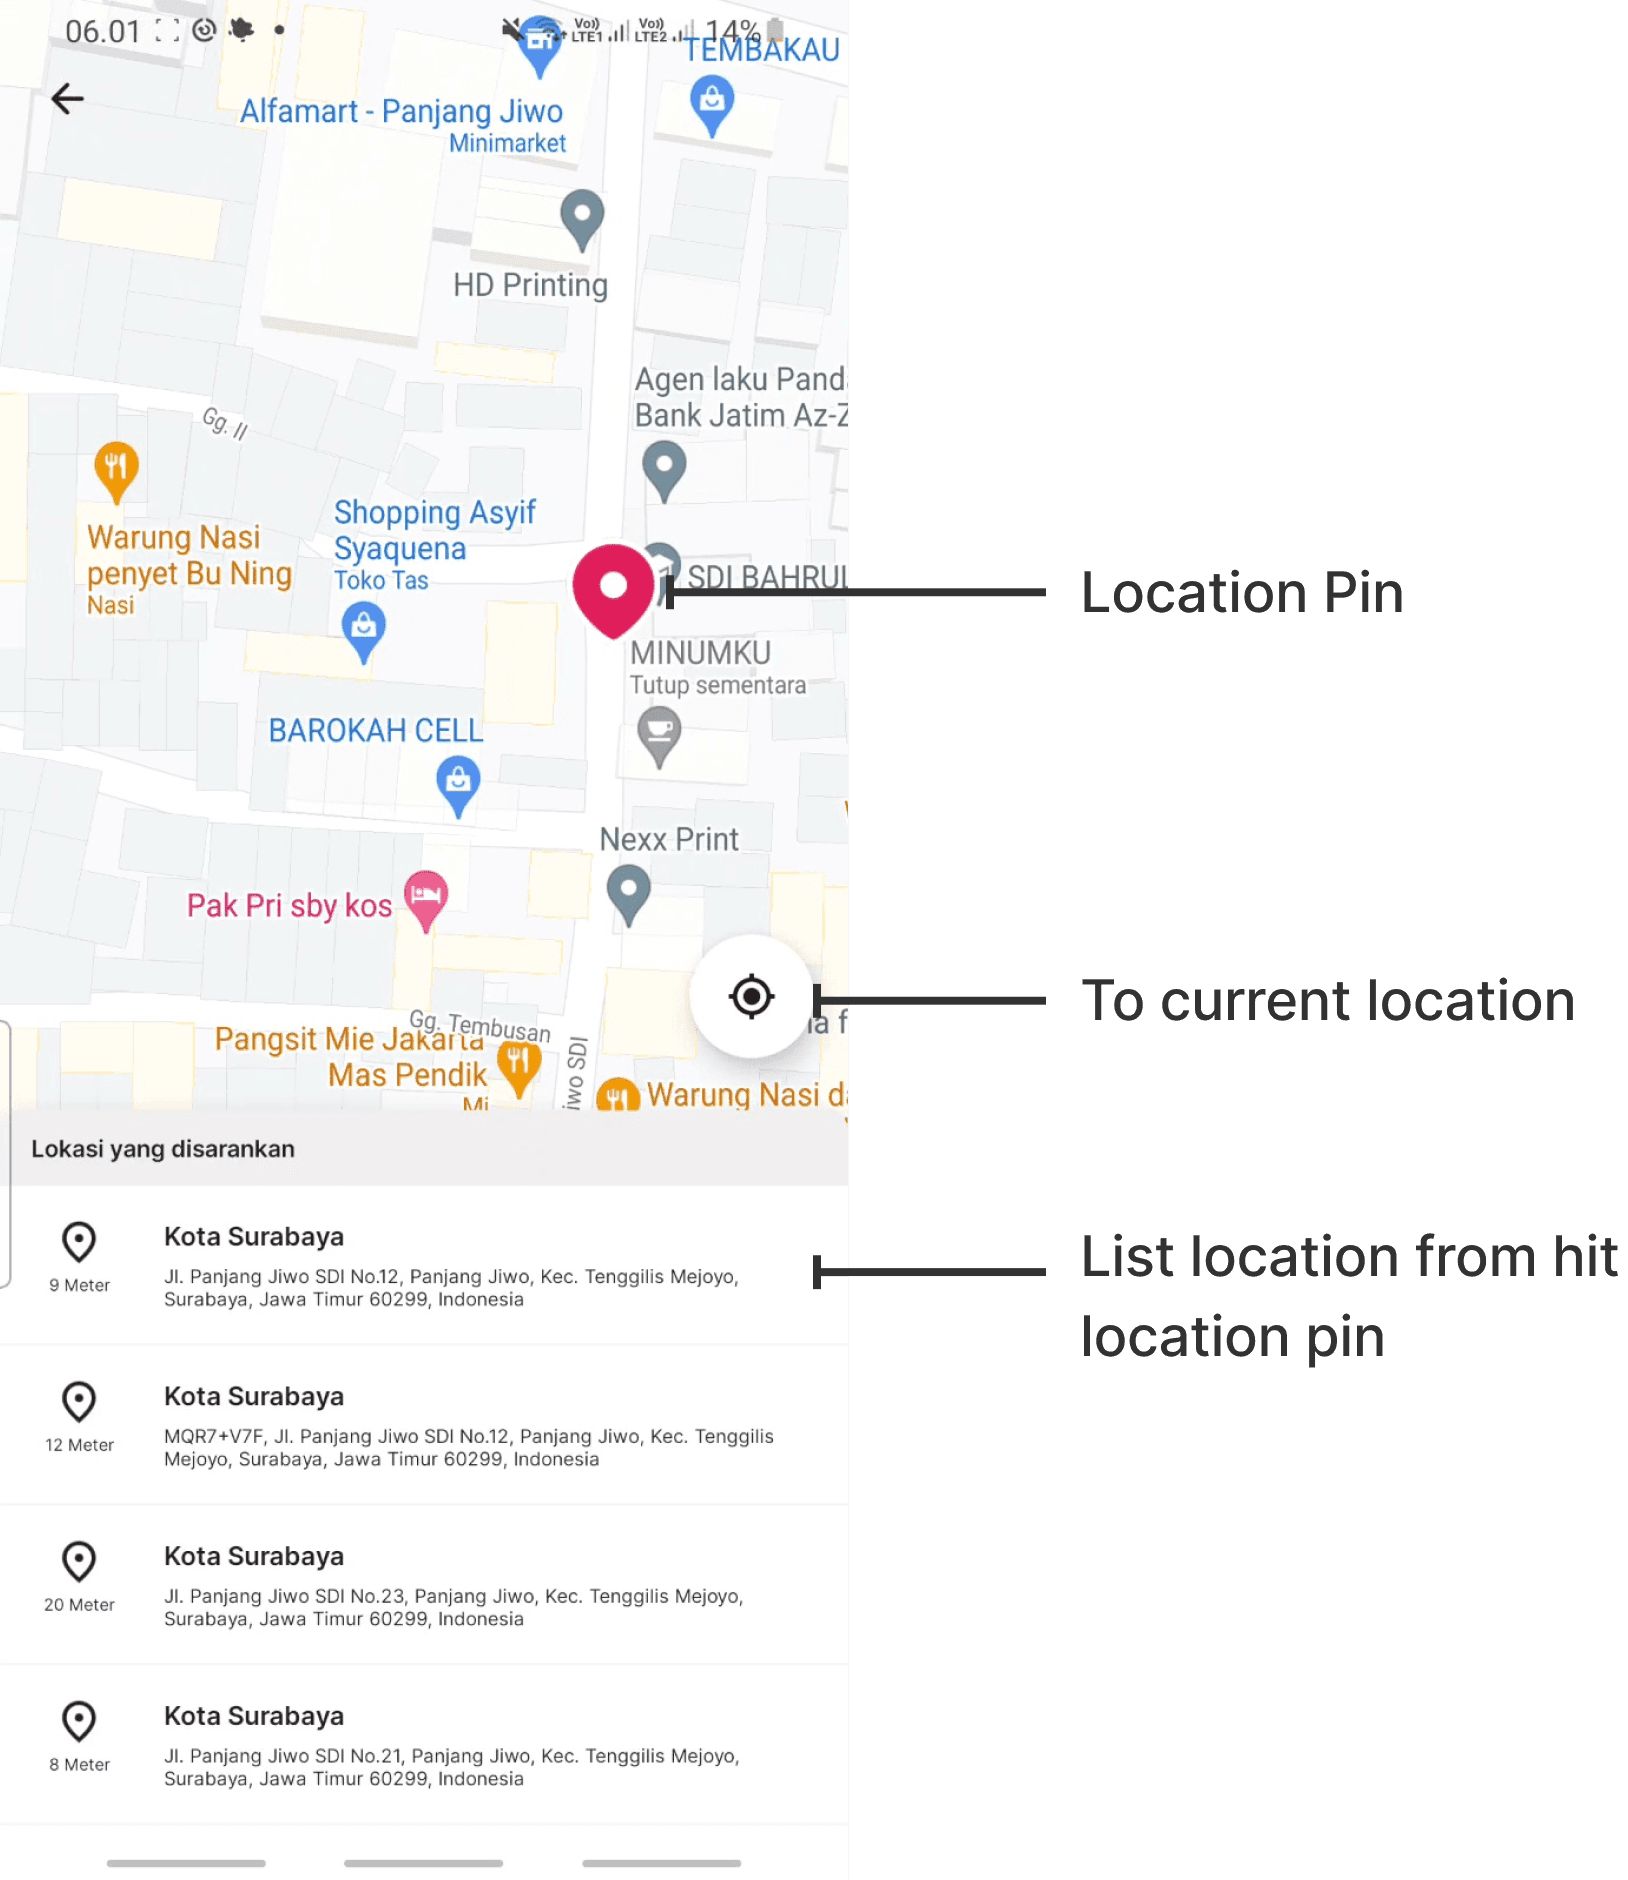
Based on survey data and reviews on the playstore, users have difficulty choosing a location point on the map, because when they click the pin map point, it is less precise to the location point.
Using the user experience like other similar applications is a cost constraint for development in business teams.
Goals
Goals
Goals
Precision Improvement: Enhance the precision of selecting a location point on the map. This involves making it easier for users to pinpoint their desired location accurately.
Efficiency in Cost Constraint: Explore ways to keep efficiency development in business without compromising on the quality of the user experience.
Impact
Impact
Impact
Choosing a location point on the map is simpler with drag and drop while maintaining business efficiency.
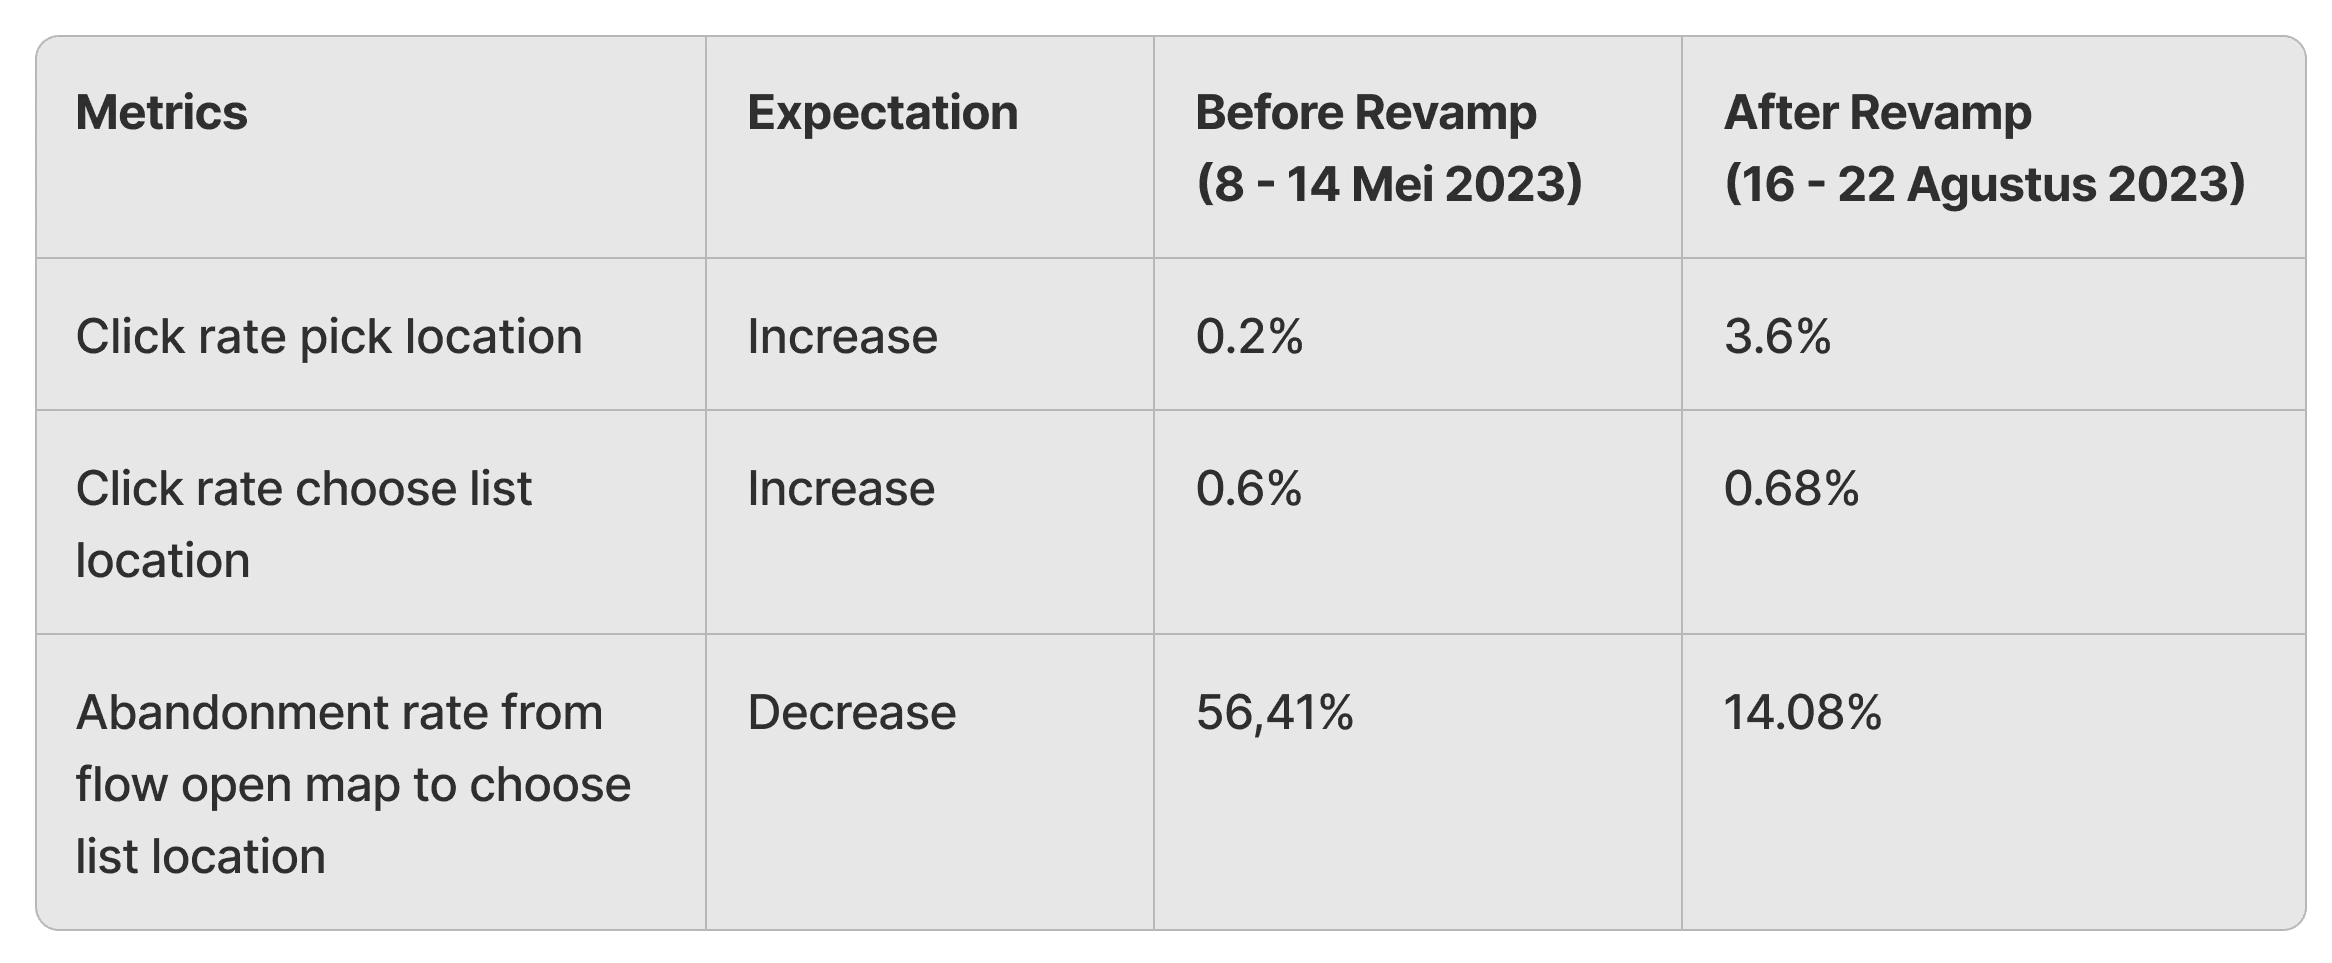
Increase of 3% click rate for selecting a location point.
Reduce abandonment to 42.33% from opening the map to picking a location from the list.
Increase of 0.08% click rate for list selection (insignificant), hence further research is needed to understand user behavior in selecting list locations.
Choosing a location point on the map is simpler with drag and drop while maintaining business efficiency.
Increase of 3% click rate for selecting a location point.
Reduce abandonment to 42.33% from opening the map to picking a location from the list.
Increase of 0.08% click rate for list selection (insignificant), hence further research is needed to understand user behavior in selecting list locations.
Here, The Process
Here, The Process
Undestanding the problem
Undestanding the problem
Undestanding the problem
A. What Happened?
A. What Happened?
Explore Survey Findings
Explore Survey Findings
In the Q3 2022 until Q1 2023 survey findings, many users complained of inaccuracies when pick locations on the map.
In the Q3 2022 until Q1 2023 survey findings, many users complained of inaccuracies when pick locations on the map.
In the Q3 2022 until Q1 2023 survey findings, many users complained of inaccuracies when pick locations on the map.
4 user
4 user
4 user
Complaints
Complaints
Complaints
Analyze Google Analytics
Analyze Google Analytics
Regarding the funnel and event count in Google Analytics, I discovered information to support the survey findings that correlated with the issue of pick locations on the map.
Regarding the funnel and event count in Google Analytics, I discovered information to support the survey findings that correlated with the issue of pick locations on the map.
Regarding the funnel and event count in Google Analytics, I discovered information to support the survey findings that correlated with the issue of pick locations on the map.
0.2%
0.2%
0.2%
Click rate pick location (week)
Click rate pick location (week)
Click rate pick location (week)
0.6%
0.6%
0.6%
Click rate click list location from hit location pin (week)
Click rate click list location from hit location pin (week)
Click rate click list location from hit location pin (week)
56%
56%
56%
Abandonment rate (week)
From flow open map until chosen list location
Abandonment rate (week)
From flow open map until chosen list location
Abandonment rate (week)
From flow open map until chosen list location
Notes: - The data above was taken a week when there was no significant marketing program. - Click rate and average time data are taken from all pages that have the feature to select a location from the map in a week.
The initial hypothesis of the problem in the map is the user's difficulty in pick a location using a pin location (click rate 0.2%), which then impacts the list locations, so that leading to a higher abandonment rate (reducing the rate from the starting page to the final destination page).
The initial hypothesis of the problem in the map is the user's difficulty in pick a location using a pin location (click rate 0.2%), which then impacts the list locations, so that leading to a higher abandonment rate (reducing the rate from the starting page to the final destination page).
The initial hypothesis of the problem in the map is the user's difficulty in pick a location using a pin location (click rate 0.2%), which then impacts the list locations, so that leading to a higher abandonment rate (reducing the rate from the starting page to the final destination page).
B. Why are users complaining about map?
B. Why are users complaining about map?
B. Why are users complaining about map?
Designer Review
Designer Review
Therefore, implementing the user experience through clicking on the map area to pick a pin point is difficult and requires quite a long time for the user, so it makes the user hesitate to choose the list location.
Therefore, implementing the user experience through clicking on the map area to pick a pin point is difficult and requires quite a long time for the user, so it makes the user hesitate to choose the list location.
C. Hearing from business and developer teams regarding restricted technology employed in map services
C. Hearing from business and developer teams regarding restricted technology employed in map services
C. Hearing from business and developer teams regarding restricted technology employed in map services
From a technical point and business of view, at the moment they are not able to offer advanced map features like other on-demand platforms. This technical limitation occurs because any movement on the map will trigger an address request to Google's map service, which may result in additional costs in using the map service. Therefore, they are holding back in applying more advanced map features with map drag interactions in the application.
From a technical point and business of view, at the moment they are not able to offer advanced map features like other on-demand platforms. This technical limitation occurs because any movement on the map will trigger an address request to Google's map service, which may result in additional costs in using the map service. Therefore, they are holding back in applying more advanced map features with map drag interactions in the application.
Take “How Might We” and define metrics
Take “How Might We” and define metrics
Take “How Might We” and define metrics
How Might We
How Might We
How Might We
How might we simplify and fast the process for users to pinpoint a precise location or come near it?
How might we inform the user about an update experience for pin determinng a location on the map?
How might we keep efficiency development in business without compromising on the quality of the user experience?
Success Metrics
Success Metrics
Success Metrics
Increase click pick location : Measuring the user take location (pin point) at map. If there is an increase, it indicates that user easy to determining pick location at map.
Decrease Abandonment rate from flow open map to choose list location : Measuring the level of users doesn't continue from the previous flow to the next flow. This metric is related to the click rate choose list location, but the value is the opposite. If the abandonment rate from opening the map to choosing a location list decreases, it indicates that after determining the location pin the user can easily and confidently choose the suggested location.
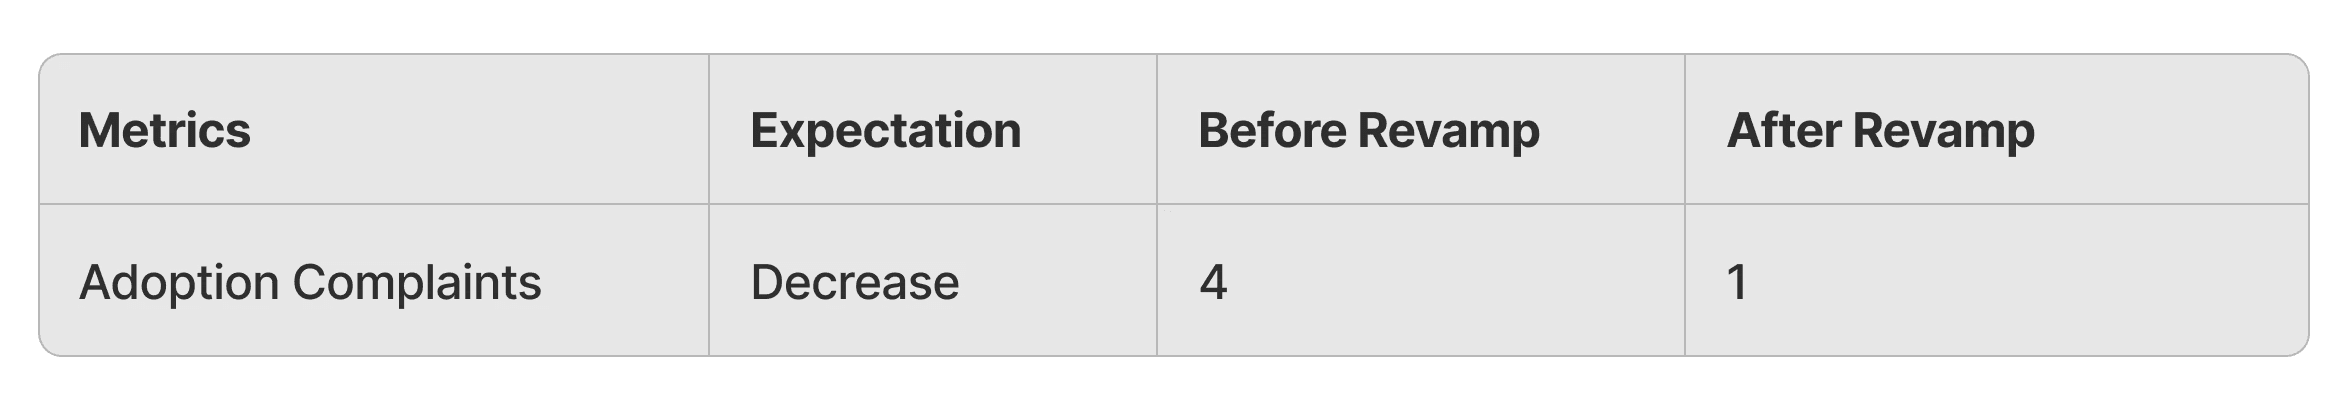
Decrease adoption complaints : Measuring user complaints in using maps in the ViuiT application. If complaints about the pick from map experience decrease, it indicates the user has reached his goal in choosing a location from the map easily and precisely.
All metrics above will be evaluated 2 month after launching the new user experience of map feature in ViuiT, as assessing it within the first week may result in biases from users still learning the new experience and not in marketing programs.
All metrics above will be evaluated 2 month after launching the new user experience of map feature in ViuiT, as assessing it within the first week may result in biases from users still learning the new experience and not in marketing programs.
Ideate and Design
Ideate and Design
Ideate and Design
How might we simplify and fast the process for users to pinpoint a precise location or come near it? But still keep efficiency development in business
How might we simplify and fast the process for users to pinpoint a precise location or come near it? But still keep efficiency development in business
How might we simplify and fast the process for users to pinpoint a precise location or come near it? But still keep efficiency development in business
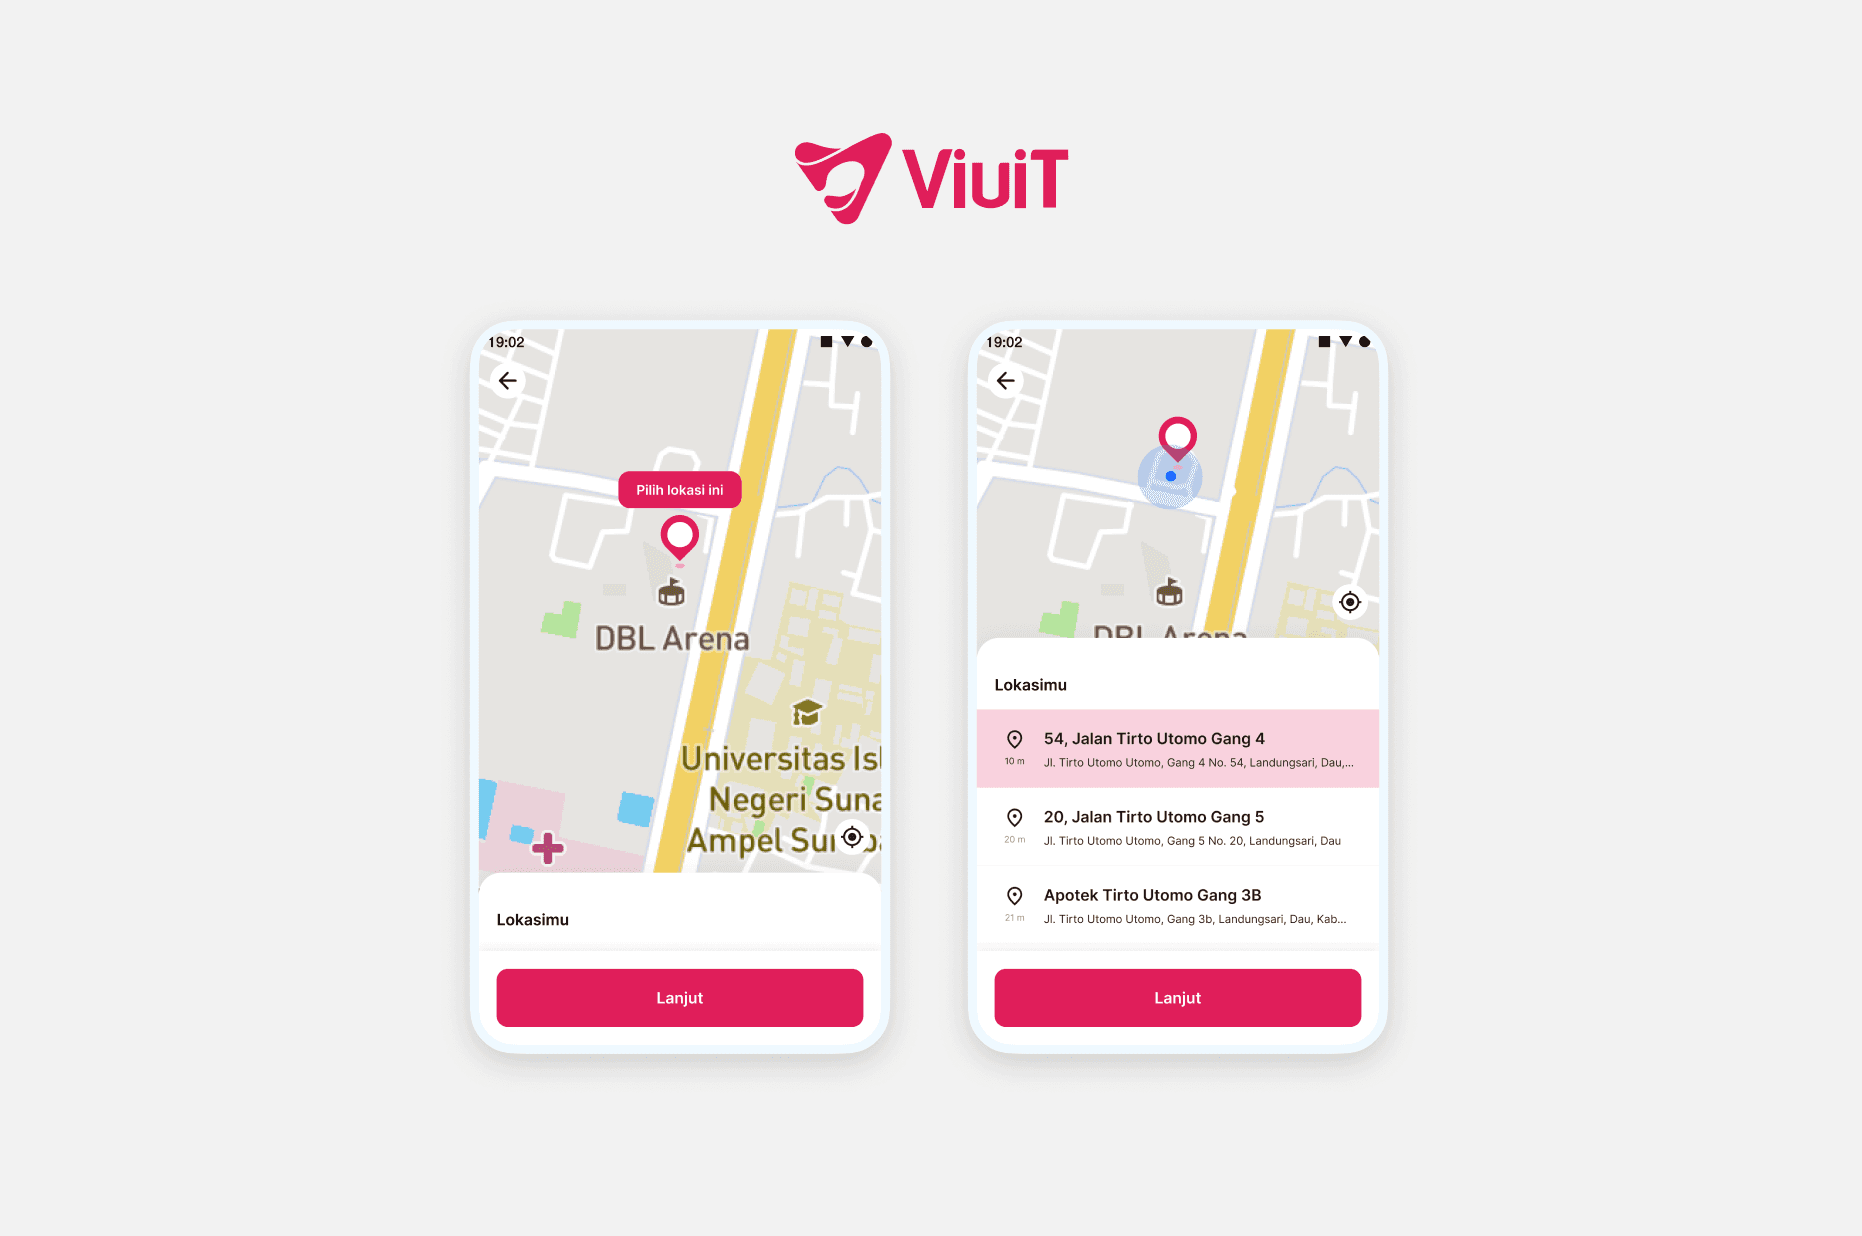
I adopted the usual map-drag behavior because the experience is easier and the user doesn't have to try to learn anymore. For hit google map location, we still adopting our team's previous technology, by clicking on the location pin, because this experience can reduce or save on map costs when pick a location from the map. (This idea has collaborated with the developer team in our daily sprints).
I adopted the usual map-drag behavior because the experience is easier and the user doesn't have to try to learn anymore. For hit google map location, we still adopting our team's previous technology, by clicking on the location pin, because this experience can reduce or save on map costs when pick a location from the map. (This idea has collaborated with the developer team in our daily sprints).
How might we inform the user about an update experience for pin determining a location on the map?
How might we inform the user about an update experience for pin determining a location on the map?
How might we inform the user about an update experience for pin determining a location on the map?
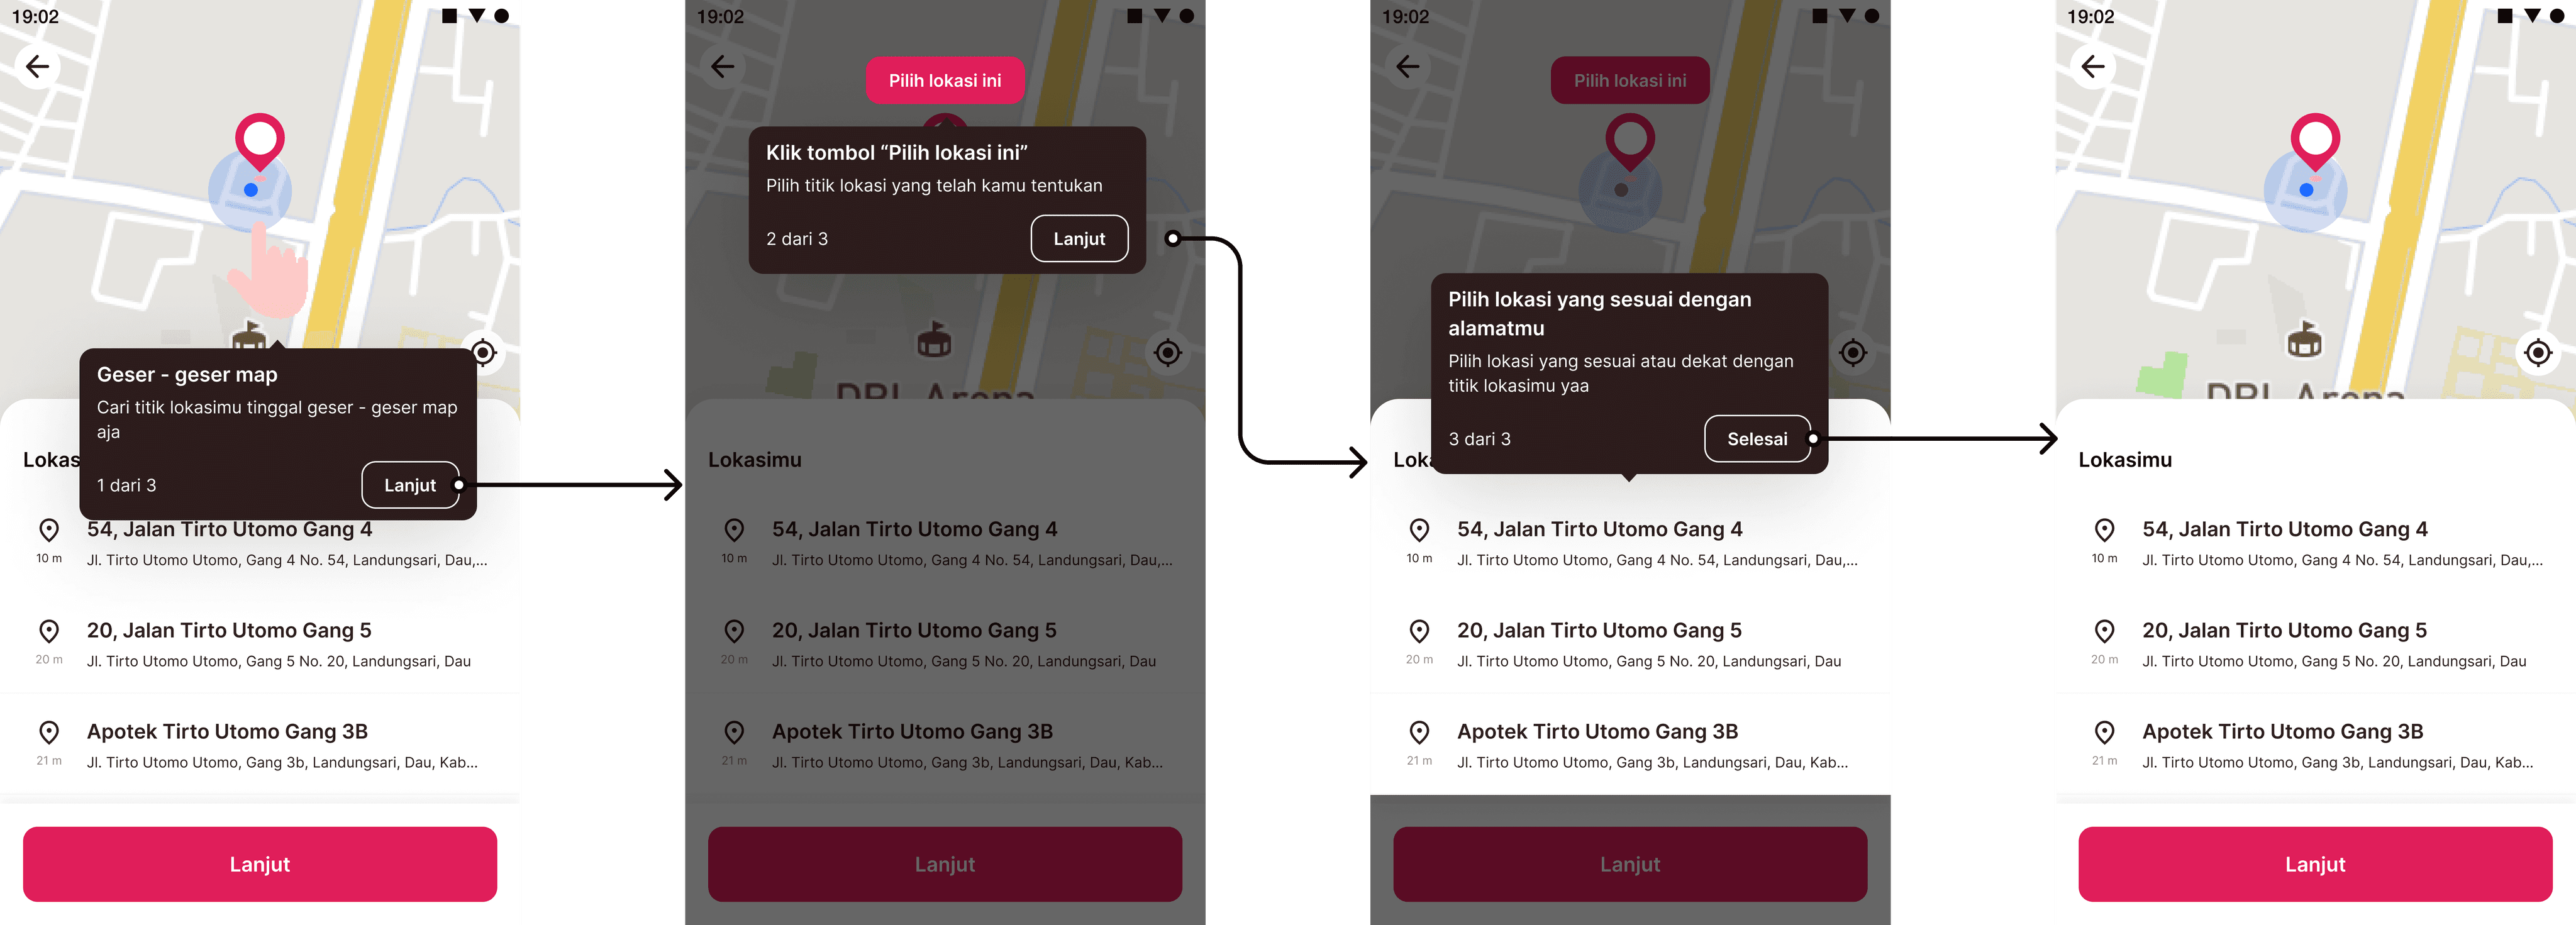
The user experience of ViuiT's newest map feature is slightly different compared to other on-demand applications. Therefore, it is important for me to provide users with information about using ViuiT's maps feature.
The user experience of ViuiT's newest map feature is slightly different compared to other on-demand applications. Therefore, it is important for me to provide users with information about using ViuiT's maps feature.
Detail Experience
Detail Experience
Detail Experience
Pick location easier just by dragging the map
Pick location easier just by dragging the map
Pick location easier just by dragging the map
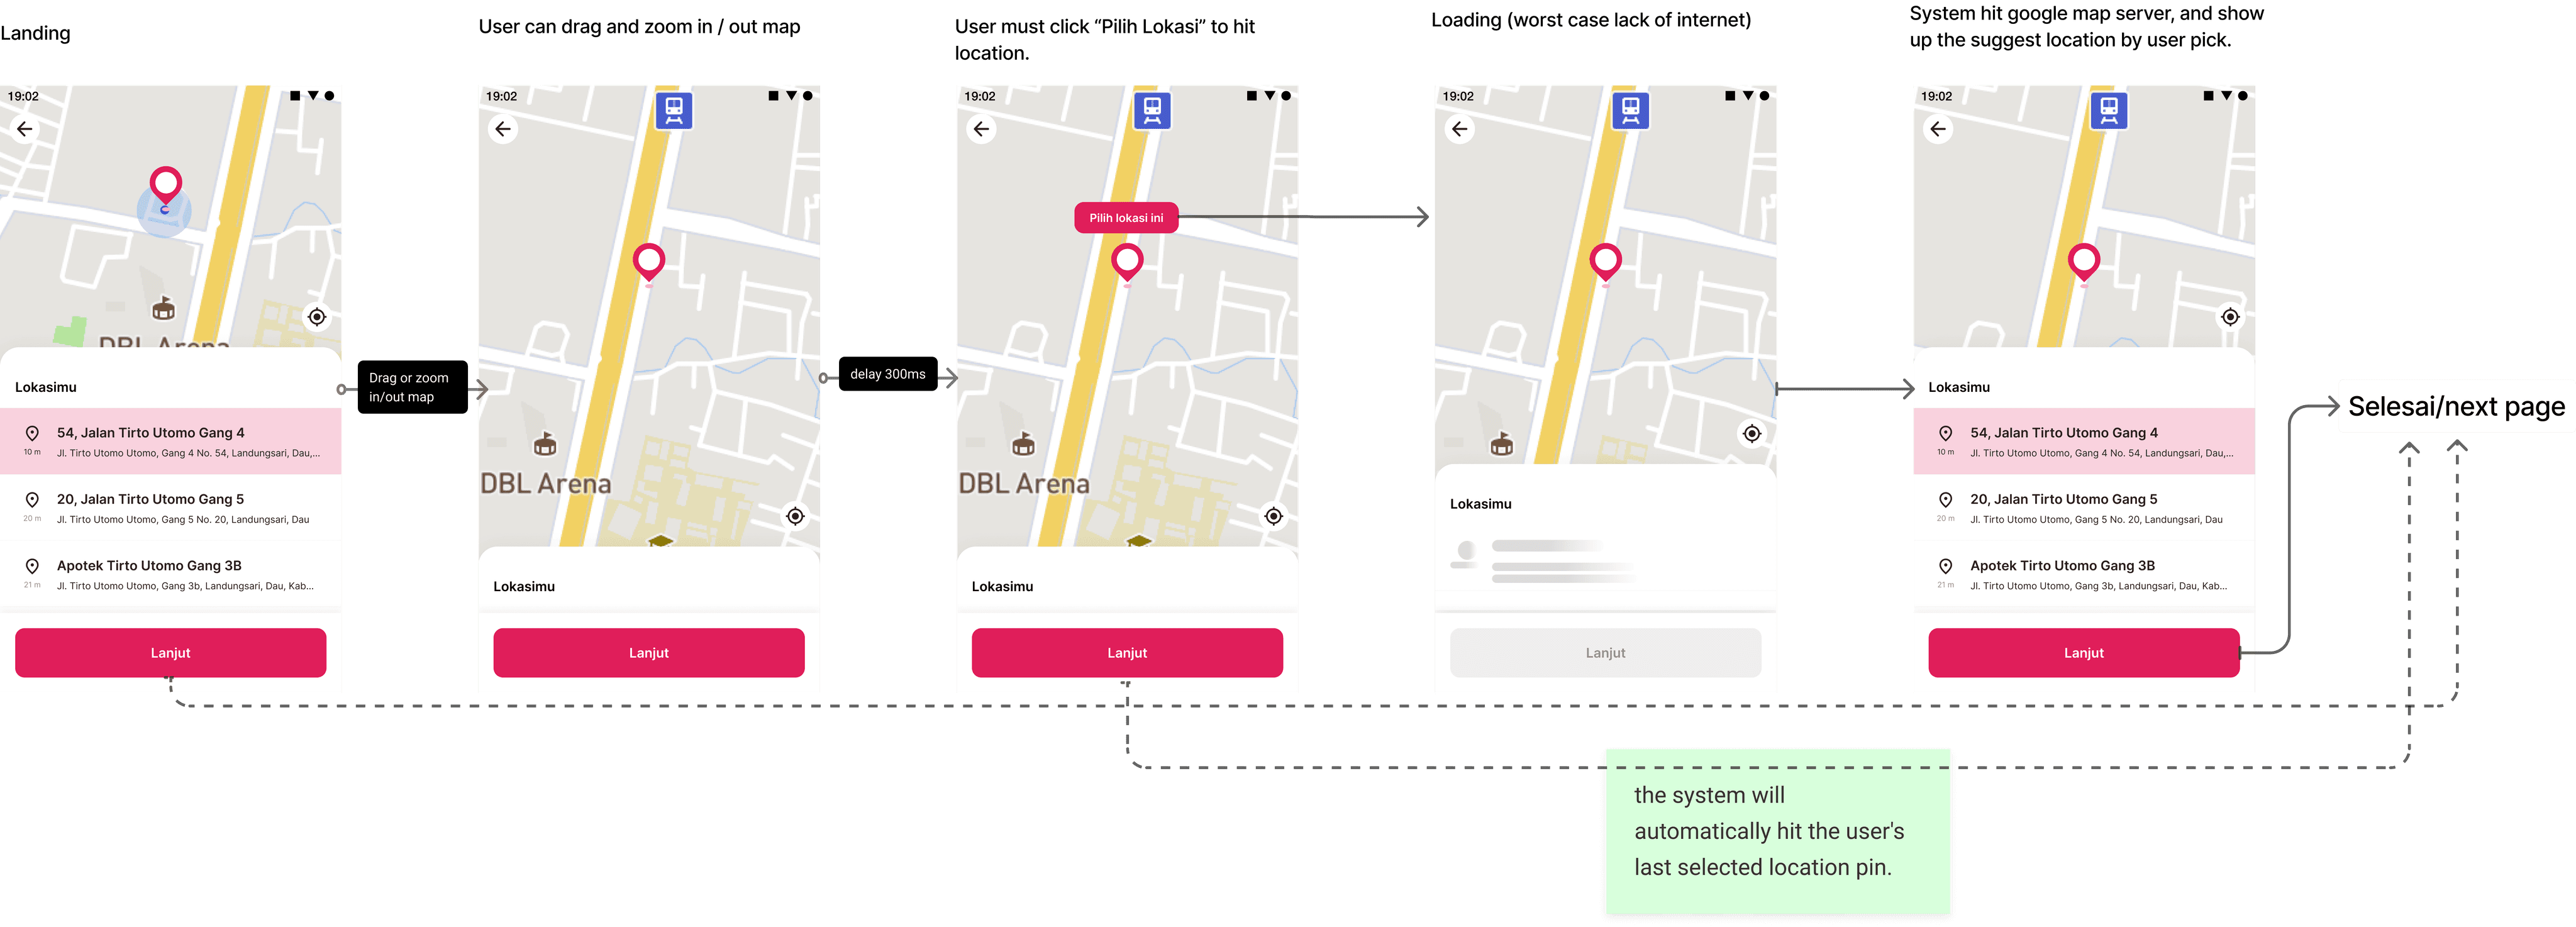
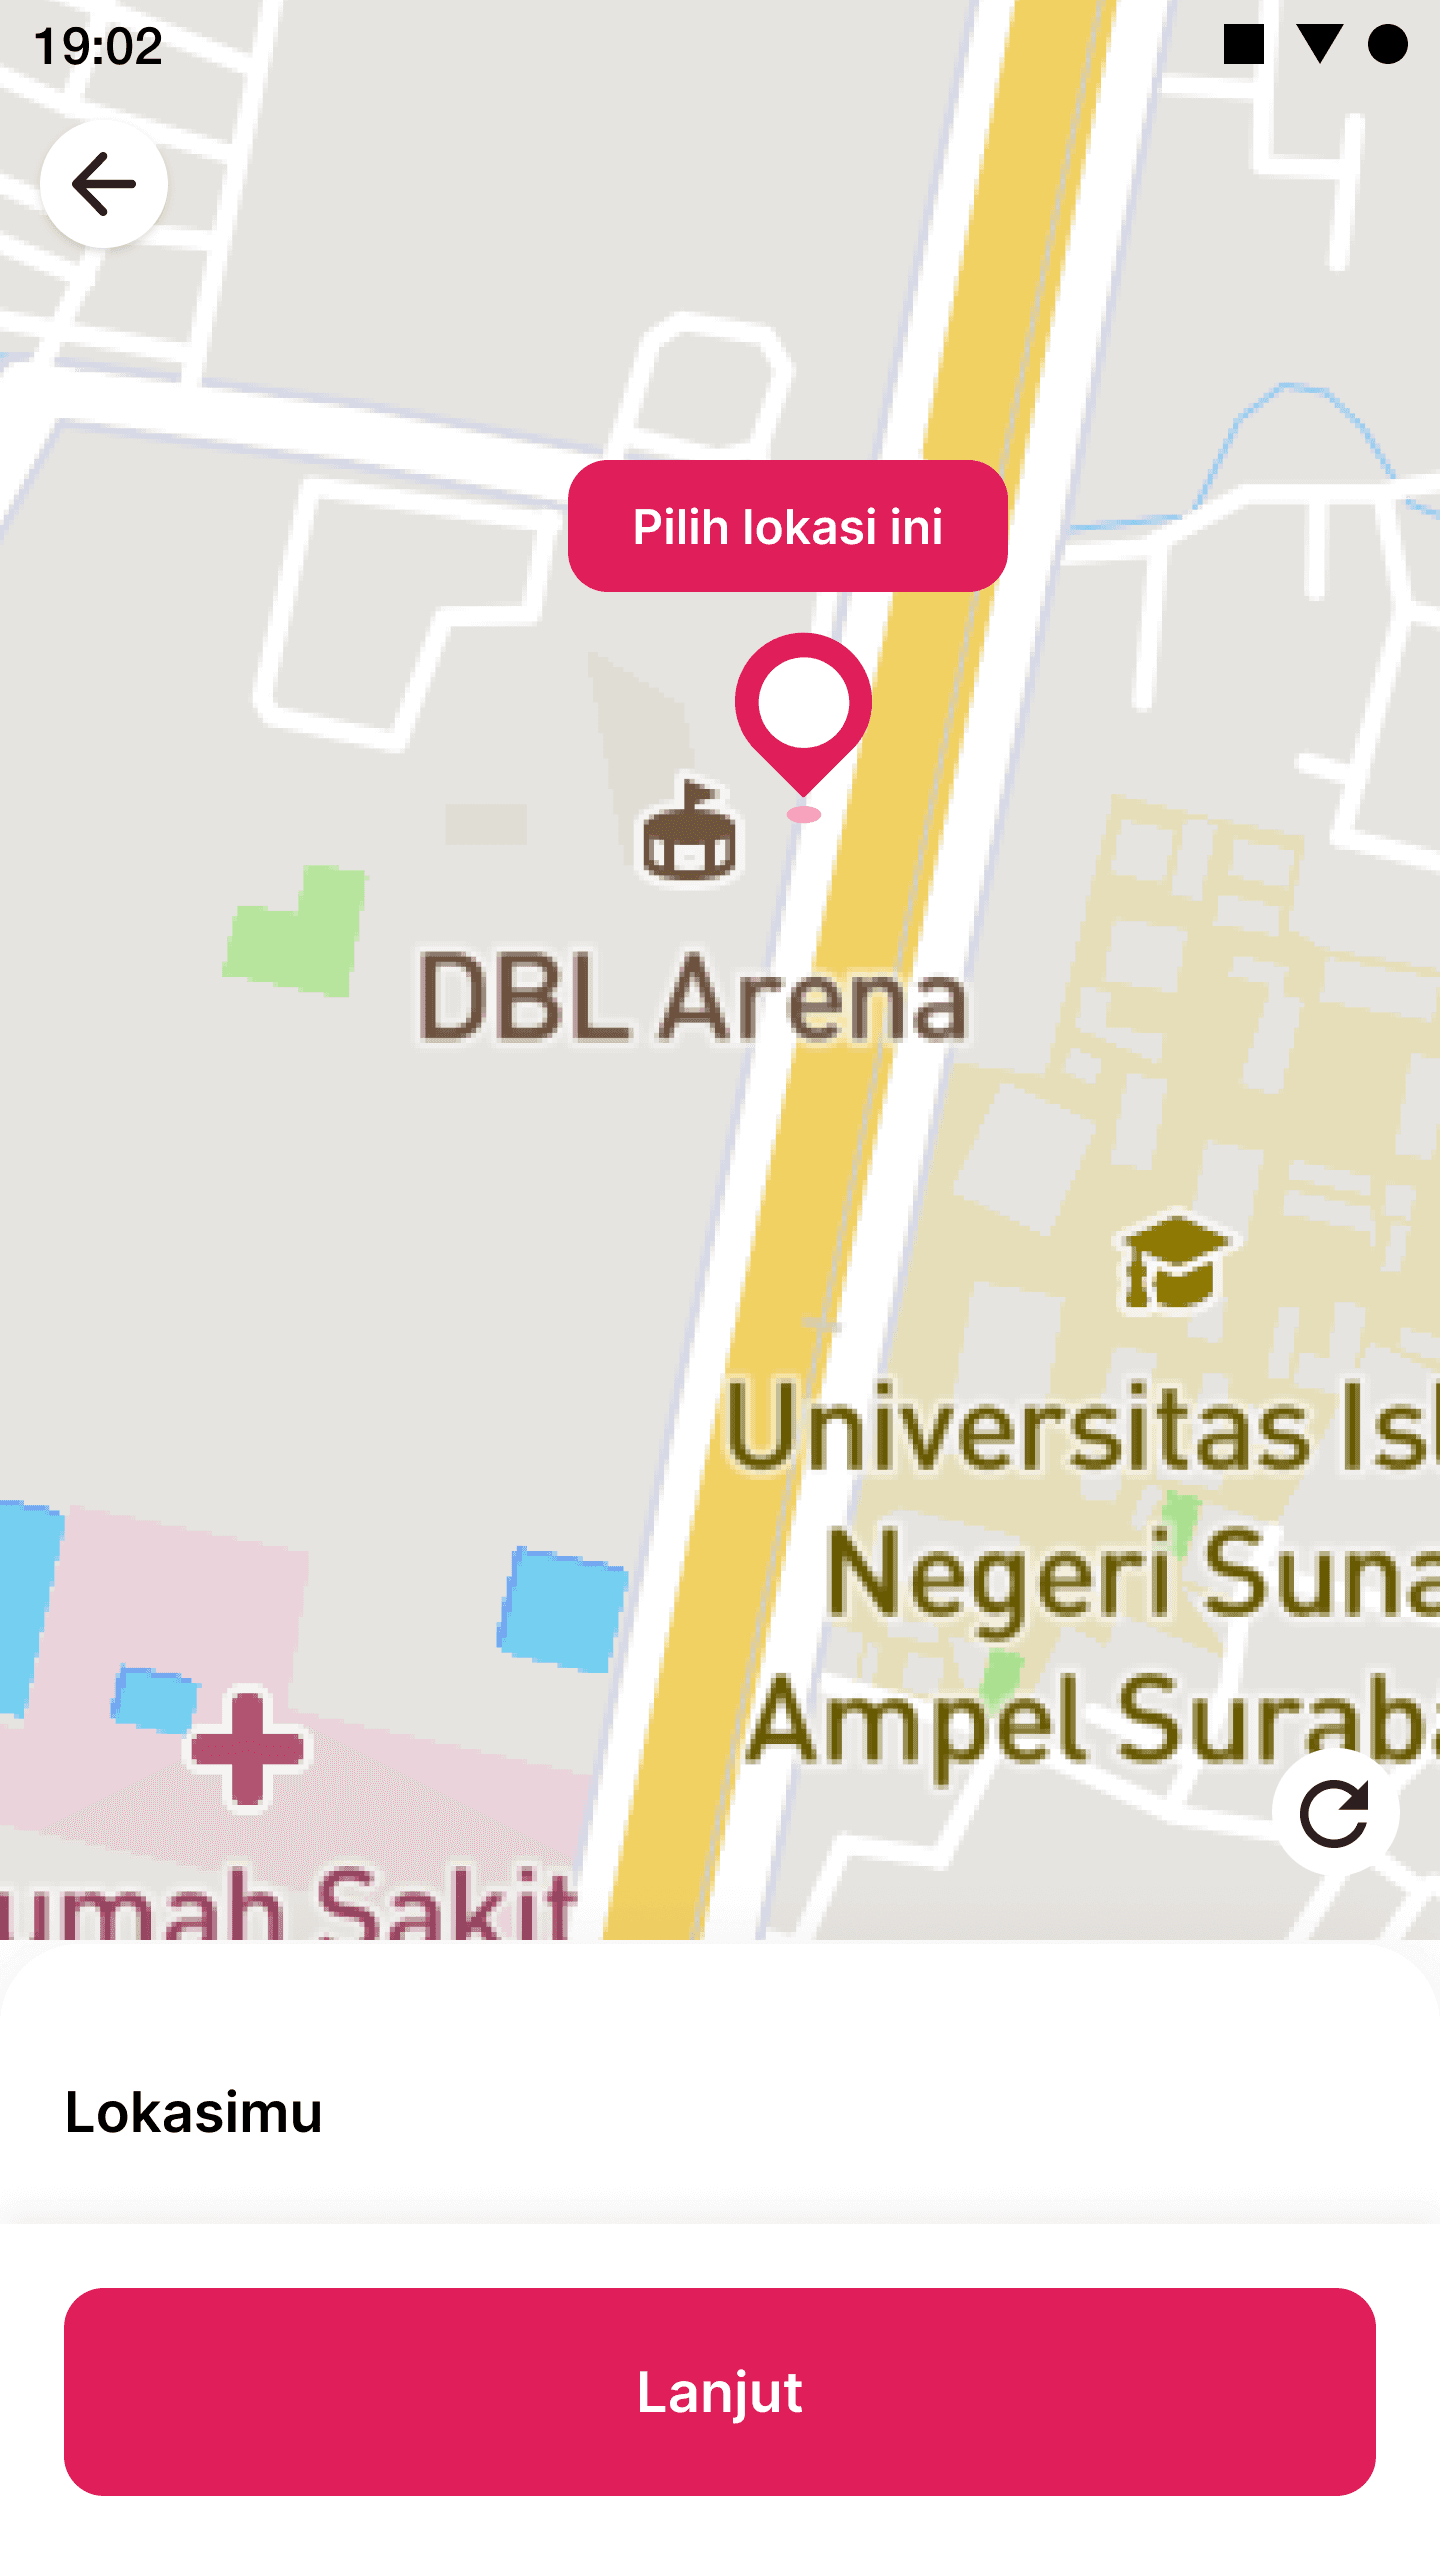
Previously, the user experience in changing the user's location had to click on the map area which often made it difficult for users, especially those with wide or large thumbs, so in the new user experience the process becomes easier just by dragging the map to set the expected location point.
Previously, the user experience in changing the user's location had to click on the map area which often made it difficult for users, especially those with wide or large thumbs, so in the new user experience the process becomes easier just by dragging the map to set the expected location point.
See prototype
Reduce Google Map service costs by avoiding direct location search when moving the map according to location points.
Reduce Google Map service costs by avoiding direct location search when moving the map according to location points.
Reduce Google Map service costs by avoiding direct location search when moving the map according to location points.
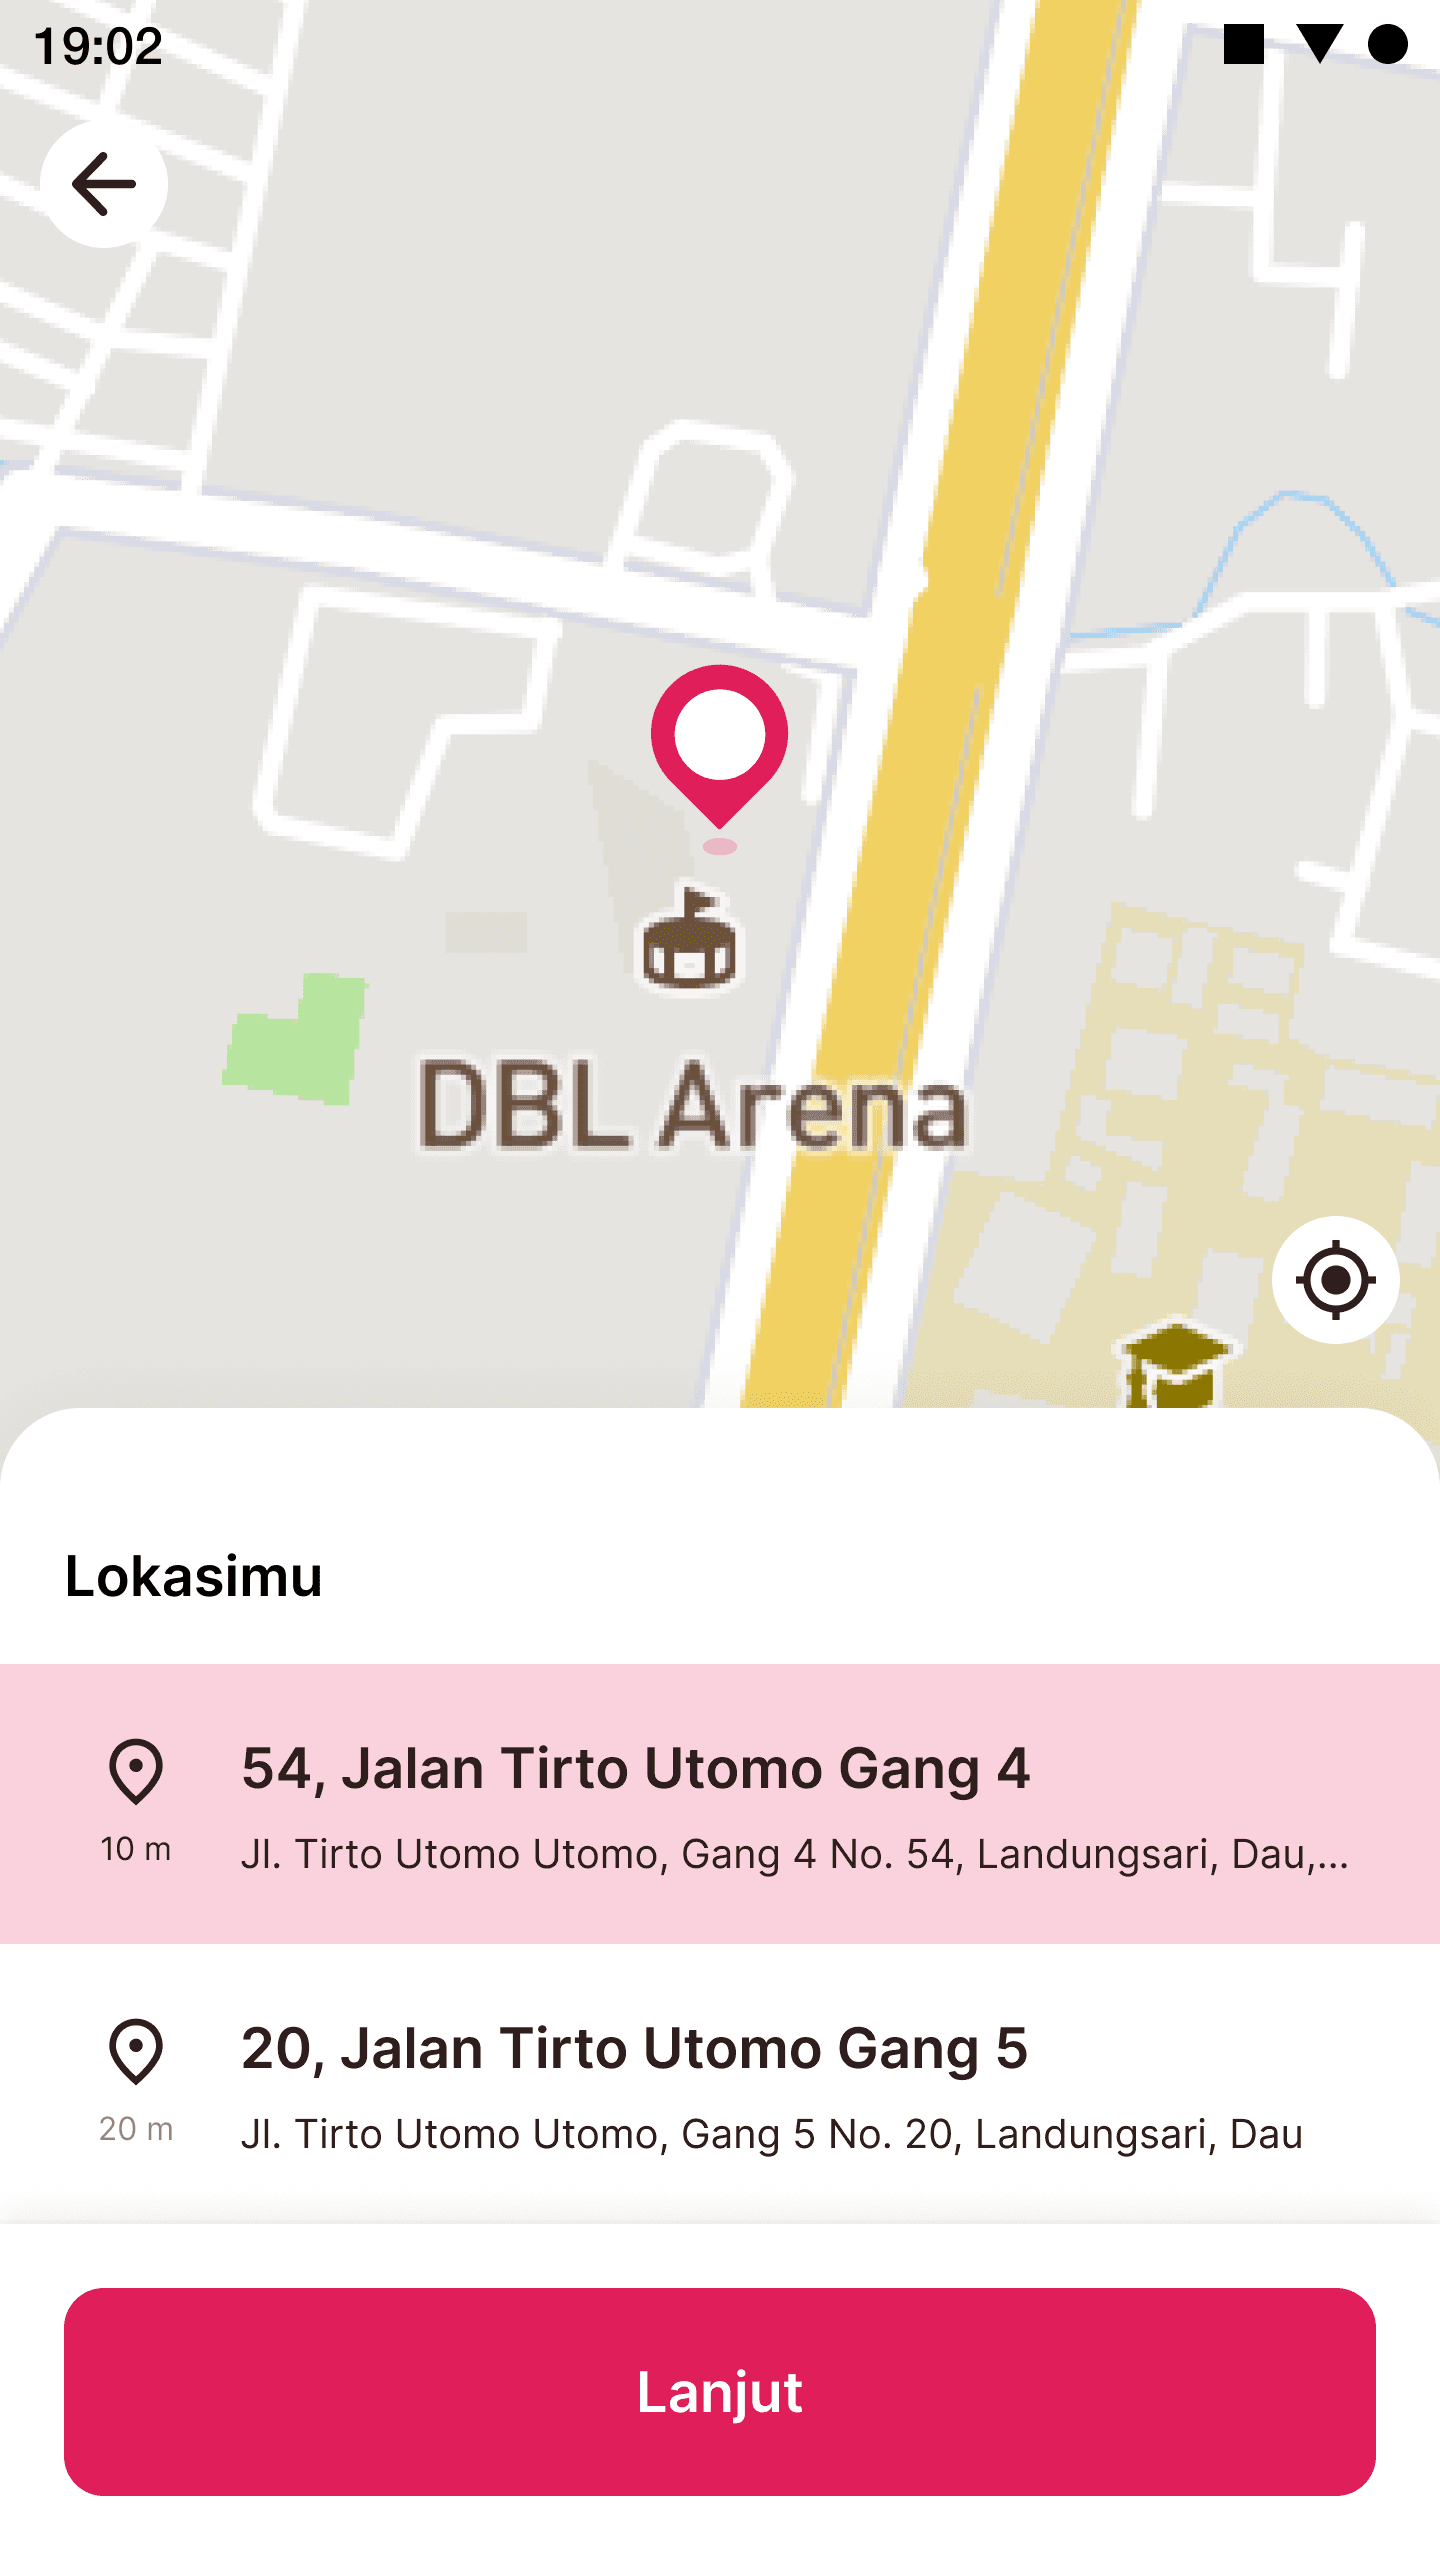
In the new user experience, pick a location from the map, after dragging the map according to the location pin, the user must click the "Pilih Lokasi Ini" button above the location pin which will then immediately hit the location.
In the new user experience, pick a location from the map, after dragging the map according to the location pin, the user must click the "Pilih Lokasi Ini" button above the location pin which will then immediately hit the location.
See prototype
Small revamp the icon pin
Small revamp the icon pin
Small revamp the icon pin
The "pick up location point" Icon area is more pointed than the previous design, aiming to help determine the location point more accurately, precisely and increasly user visibility.
The "pick up location point" Icon area is more pointed than the previous design, aiming to help determine the location point more accurately, precisely and increasly user visibility.

Before

After
Testing and Impact
Testing and Impact
Testing and Impact
We live testing and tracking by Google Analytics and Survey in Q3 2023
We live testing and tracking by Google Analytics and Survey in Q3 2023
We live testing and tracking by Google Analytics and Survey in Q3 2023
We use testing methods such as tracking and analyzing user behavior using Google Analytics, focusing on click rate and funnel. It will take approximately two months after launch to avoid user bias while learning new features and avoiding significant marketing program periods.
We use testing methods such as tracking and analyzing user behavior using Google Analytics, focusing on click rate and funnel. It will take approximately two months after launch to avoid user bias while learning new features and avoiding significant marketing program periods.
Retrospective
Retrospective
Retrospective
Integrate current quantitative and qualitative data
Integrate current quantitative and qualitative data
Integrating both quantitative and qualitative data significantly aids the research design process. Quantitative data identifies the issues that arise and evaluates test assumptions. Then, qualitative data assists in clarifying why the issues occur.
Integrating both quantitative and qualitative data significantly aids the research design process. Quantitative data identifies the issues that arise and evaluates test assumptions. Then, qualitative data assists in clarifying why the issues occur.
The importance of designers understand the boundaries in business and technology
In addition to the importance of having empathy for users, empathy is also needed for business and technology conditions, especially for startups that have just been established and have not yet made a profit. This aims to ensure the continuity of business costs efficiently.
In addition to the importance of having empathy for users, empathy is also needed for business and technology conditions, especially for startups that have just been established and have not yet made a profit. This aims to ensure the continuity of business costs efficiently.
Determine the time for tracking analytics
Determine the time for tracking analytics
In collecting analytical data, it is important to know the right time in order to avoid possible biases. For example, a promotional campaign that increase registration or sales processes can create bias. Furthermore, when users need to learn new features, this may lead to diverse biases. Therefore, it is very important to determine the time or conditions of the same comparison when tracking data before and after repair.
In collecting analytical data, it is important to know the right time in order to avoid possible biases. For example, a promotional campaign that increase registration or sales processes can create bias. Furthermore, when users need to learn new features, this may lead to diverse biases. Therefore, it is very important to determine the time or conditions of the same comparison when tracking data before and after repair.
Thanks to
Thanks to
I am deeply grateful to Tim Developer for contributing insightful concepts and aiding in the development of testing tools, also my UI/UX workmates Panji Agung who helped me in crafting the map dragging interaction prototype in Figma. Moreover, I am appreciative of my mentor Rizky Ali Syaifurrahman's aid in providing helpful input and solutions regarding the obstacles of this case.
I am deeply grateful to Tim Developer for contributing insightful concepts and aiding in the development of testing tools, also my UI/UX workmates Panji Agung who helped me in crafting the map dragging interaction prototype in Figma. Moreover, I am appreciative of my mentor Rizky Ali Syaifurrahman's aid in providing helpful input and solutions regarding the obstacles of this case.


© Framer Inc. 2023