WHAT HAVE I DONE, SPECIFICALLY
Researcher & Designer
I conducted desk research, analyzed previous research findings, created Hi-Fi designs and detailed interactions, deliverables, and measurements.
Design Strategy
Collaborated and discussed with the development team, asking for input from the team, and negotiated to balance the design with user needs, business goals, and technical issue.
BACKGROUND
Viuit is an on-demand service application that offers various services such as food delivery, transportation, parcel delivery, and shopping, with additional social media features that make it fun and interactive for users to make food or product purchases. Currently, ViuiT has successfully operated in several cities in East Java and has thousands of loyal users.
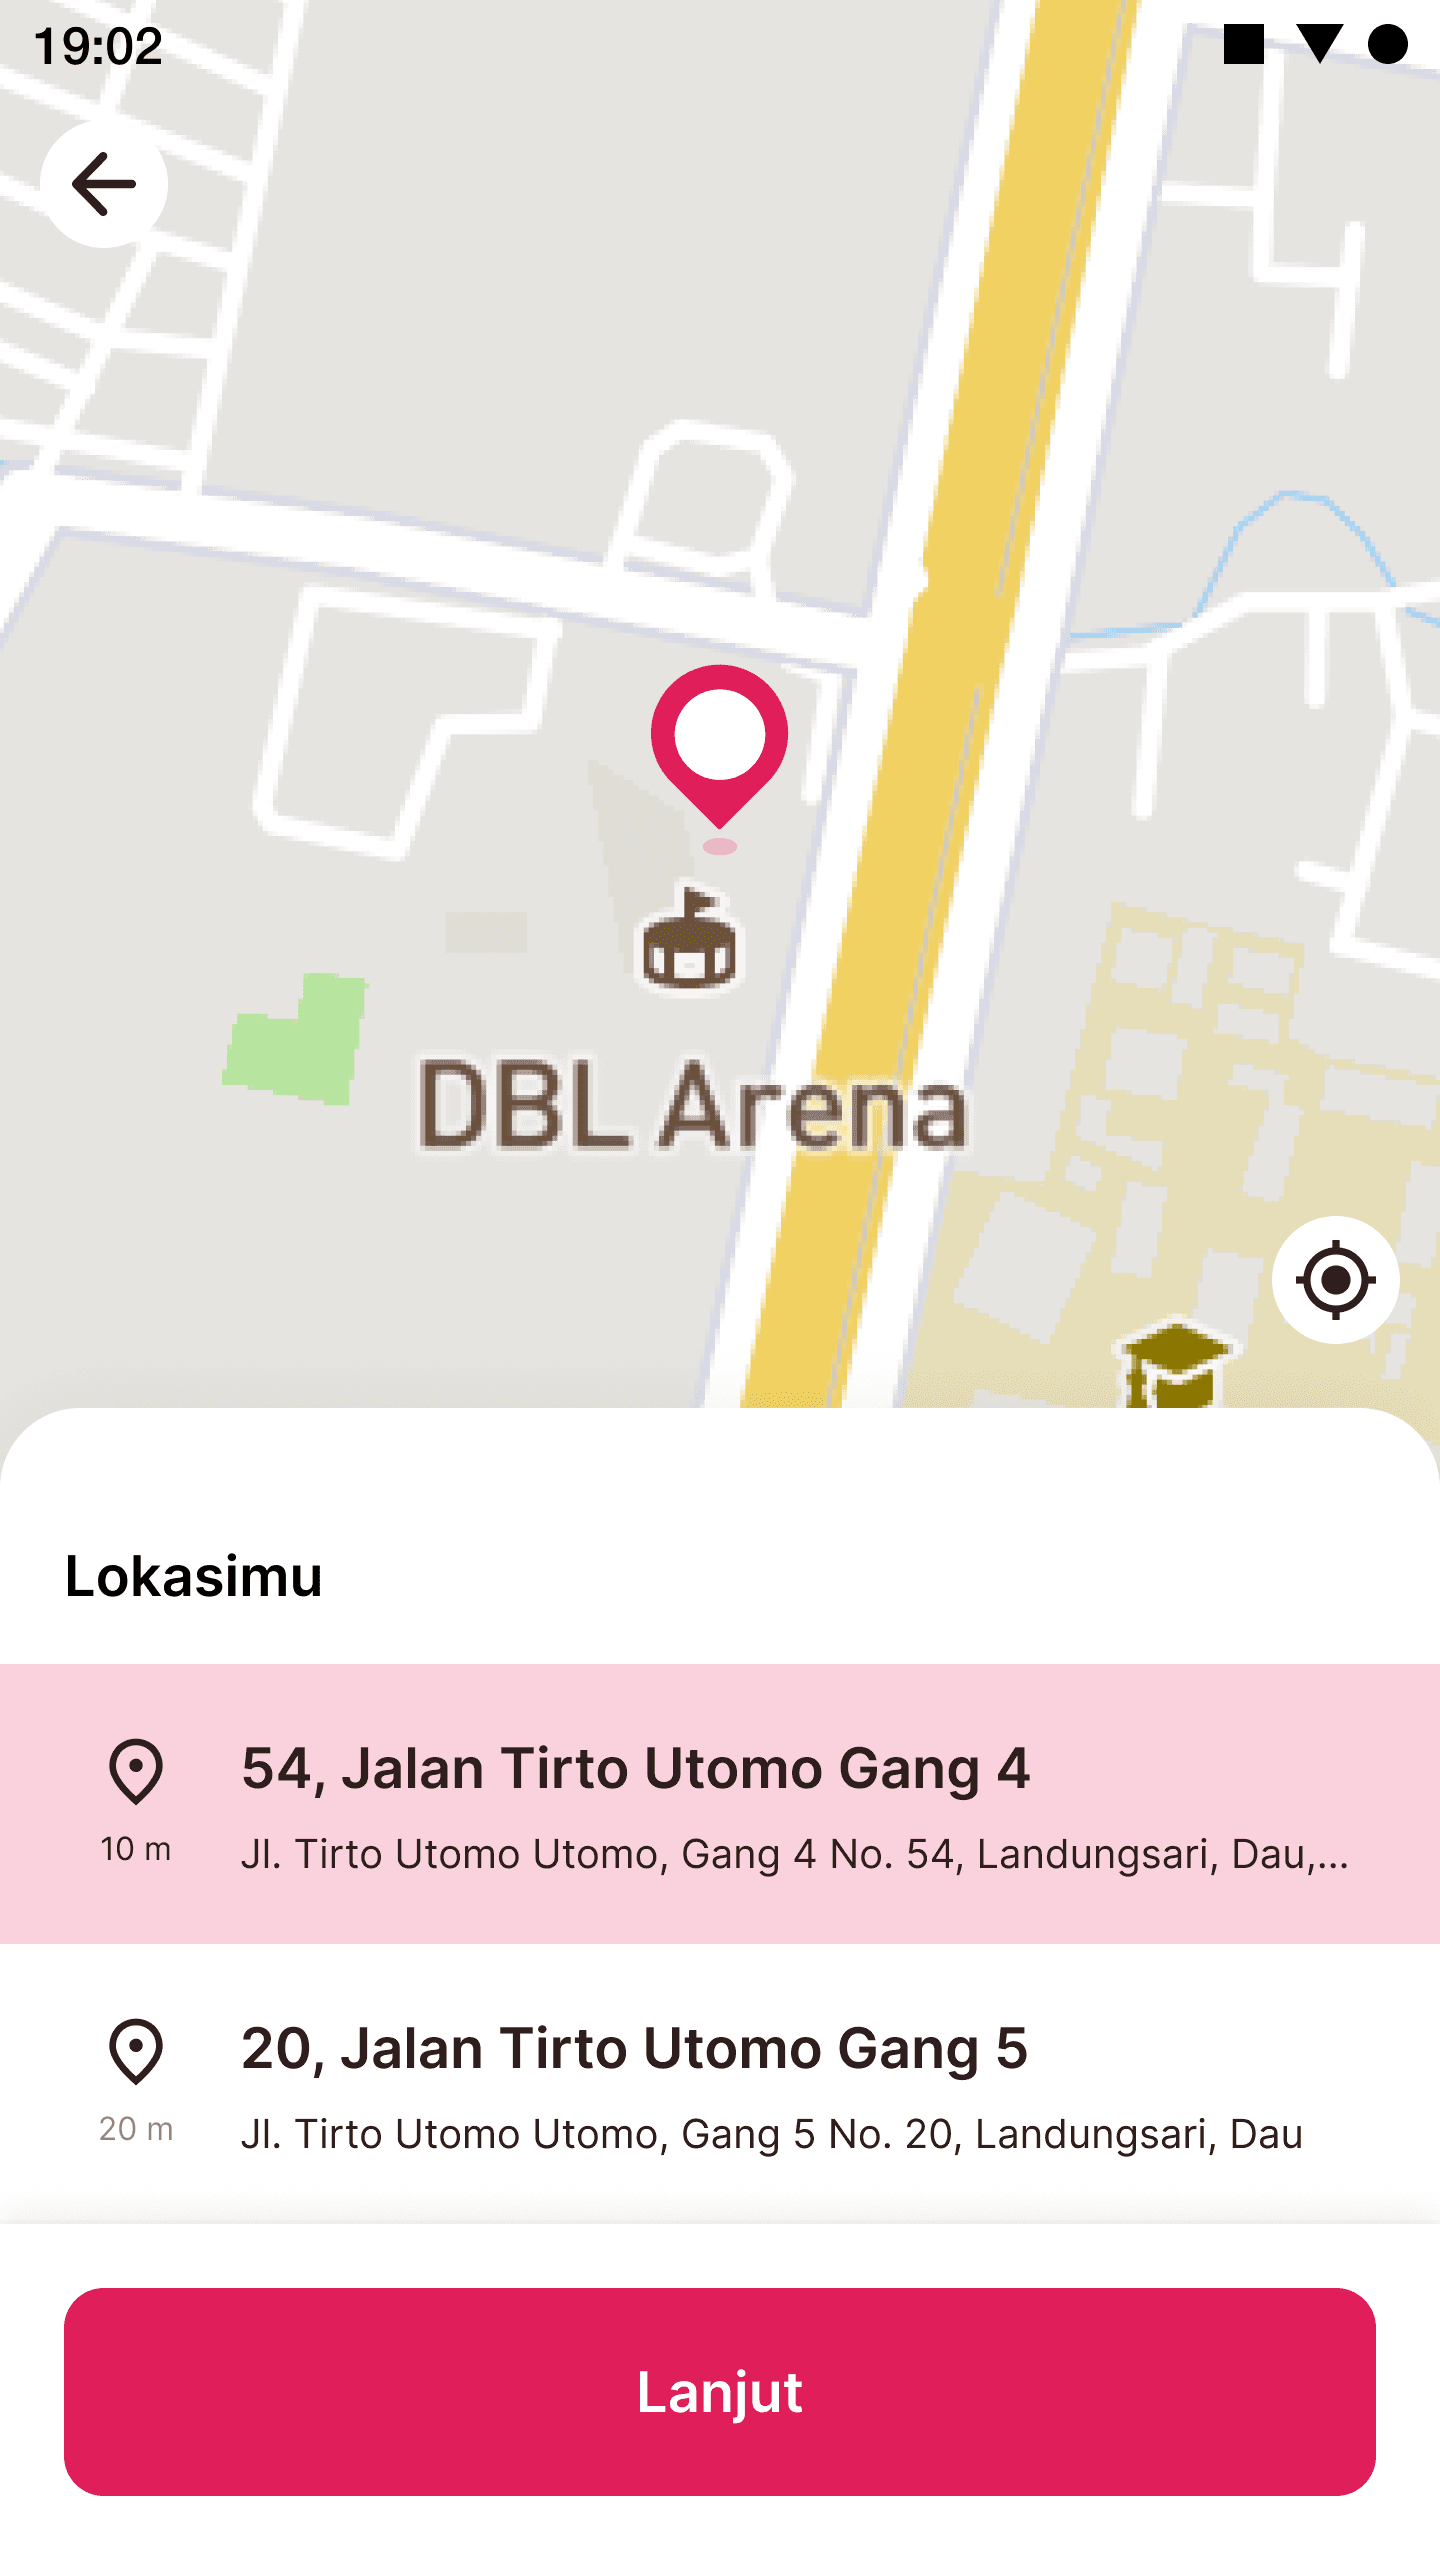
As a delivery app, the map or "Map" feature is crucial in the ordering process as it helps users pick locations accurately.
PROBLEM CHALLENGES
PROBLEM 1
User Needs : User have difficulty choosing a location point on the map
Based on survey data and reviews on the playstore, users have difficulty choosing a location point on the map, because when they click the pin map point, it is less precise to the location point.
PROBLEM 2
Technology & Business Limitation : Using the user experience like other similar applications is a cost constraint for development in business teams.
Viuit had business challenges and project time constraints that made the performance of the map feature, unlike the standard usage of maps. So, using the user experience like other similar applications (Gojek & Grab) is a cost map constraint for development in business teams.
GOALS
GOAL 1
Precision Improvement
Enhance the precision of selecting a location point on the map. This involves making it easier for users to pinpoint their desired location accurately.
GOAL 2
Efficiency in Development
Explore ways to keep efficiency development in business without compromising on the quality of the user experience.
IMPACTS
Enhance the precision of map location selection and simpler user interaction compared to the previous interaction, without undermining the efficiency of the cost map.
Click rate location
Expectation : Increase
Before Revamp
0.2%
8-14 May 2023
After Revamp
3.6%
16-22 August 2023
Expectation : Increase
Before Revamp
0.6%
8-14 May 2023
After Revamp
0.68%
16-22 August 2023
Expectation : Decrease
Before Revamp
56.41%
8-14 May 2023
After Revamp
14.08%
16-22 August 2023
Expectation : Decrease
Before Revamp
4
After Revamp
2
Understanding the problem
Every quarter, my team and I conduct evaluative studies (survey) to gather feedback from customers regarding Viuit service. Besides, we also evaluate Google Analytics on journey user experiences monthly.
The initial hypothesis of the problem in the map is the user's difficulty in pick a location using a pin location (click rate 0.2%), which then impacts the list locations, so that leading to a higher abandonment rate (reducing the rate from the starting page to the final destination page).
Click rate pick location (week)
Click rate click list location from hit location pin (week)
Abandonment rate (week). From flow open map until chosen list location
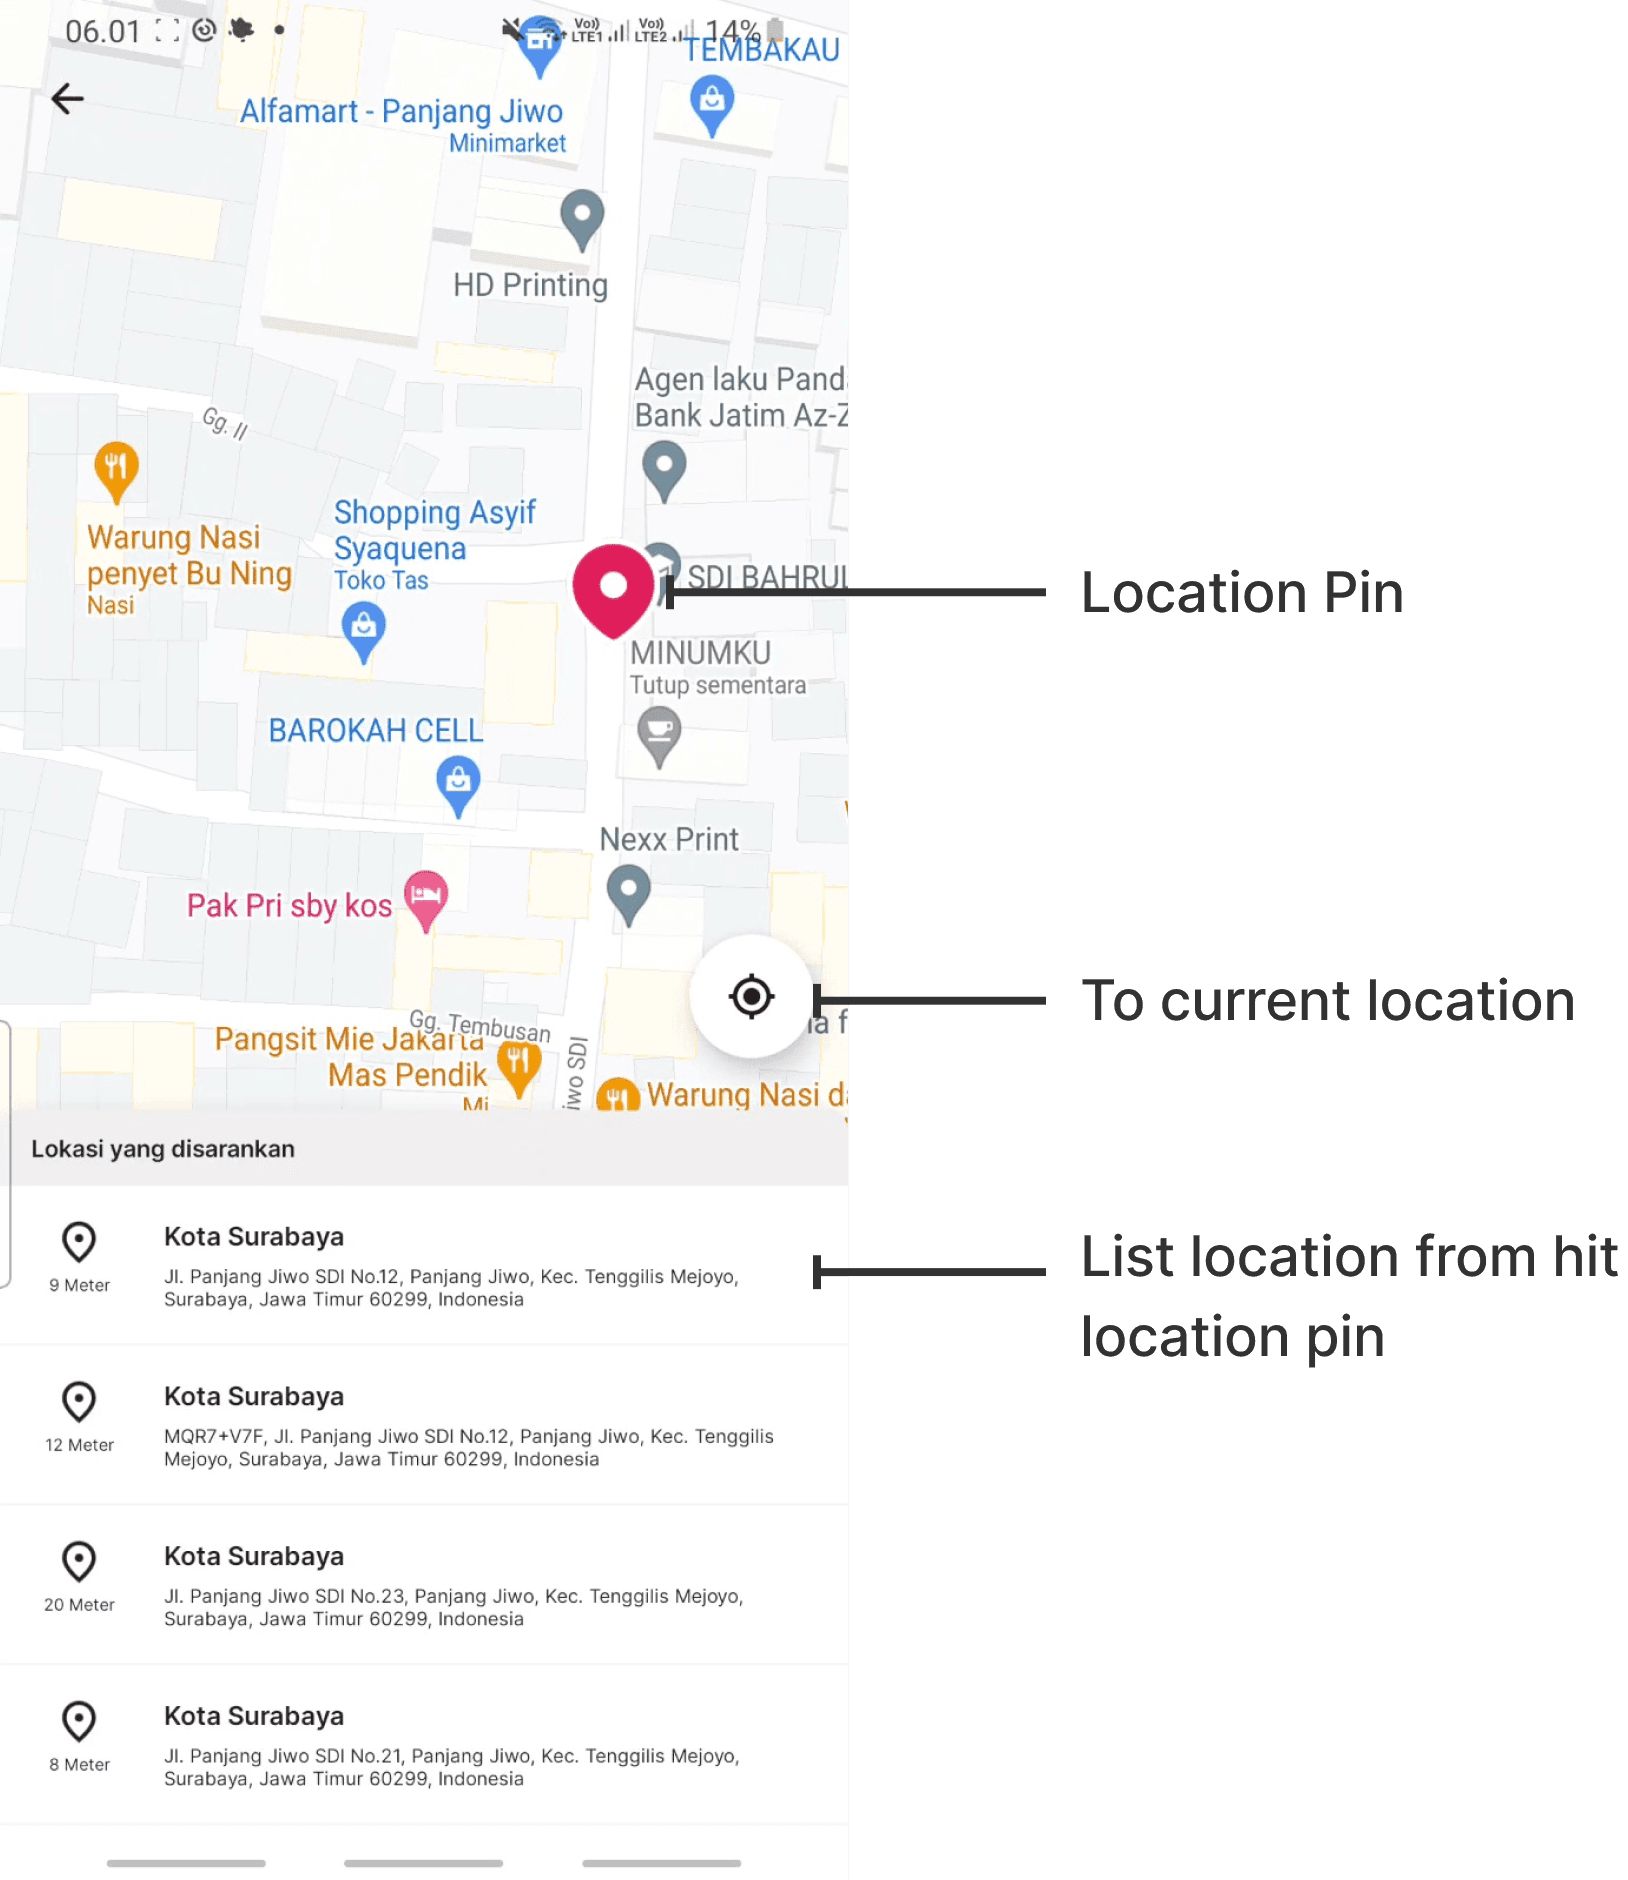
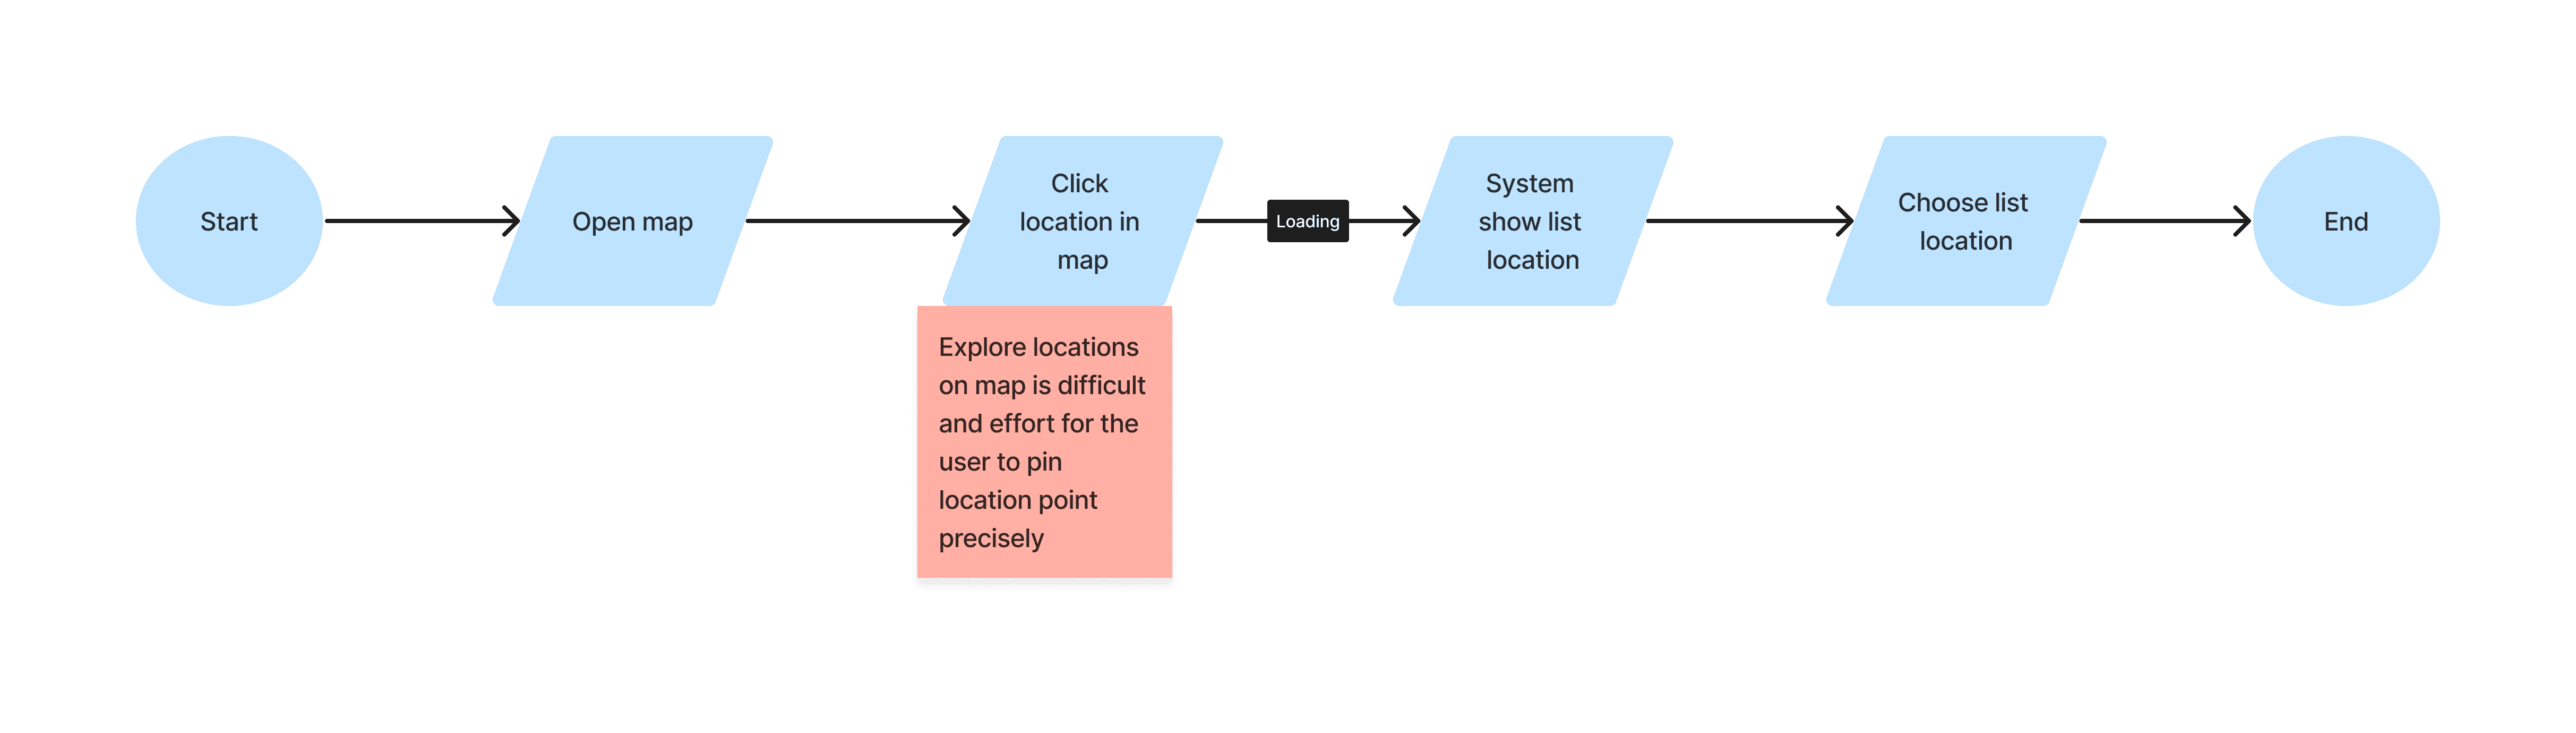
B. Why are user complaints about the map's location selection?
Interaction to explore locations on map is difficult and effort for the user to pin location point precisely.
The interaction between the finger area and the screen tends to make it less accurate in clicking the right point.
So that, the problems are…
How Might We
Increase click pick location
Measuring the user take location (pin point) at map. If there is an increase, it indicates that user easy to determining pick location at map.
Decrease Abandonment rate from flow open map to choose list location
Measuring the level of users doesn't continue from the previous flow to the next flow. This metric is related to the click rate choose list location, but the value is the opposite. If the abandonment rate from opening the map to choosing a location list decreases, it indicates that after determining the location pin the user can easily and confidently choose the suggested location.
Decrease adoption complaints
Measuring user complaints in using maps in the Viuit application. If complaints about the pick from map experience decrease, it indicates the user has reached his goal in choosing a location from the map easily and precisely.
Ideate and design for HMW 1 & 2
How might we simplify and fast the process for users to pinpoint a precise location or come near it? But still keep efficiency development in business
BEFORE REVAMP : USER FLOW CHOOSE LOCATION ON MAP
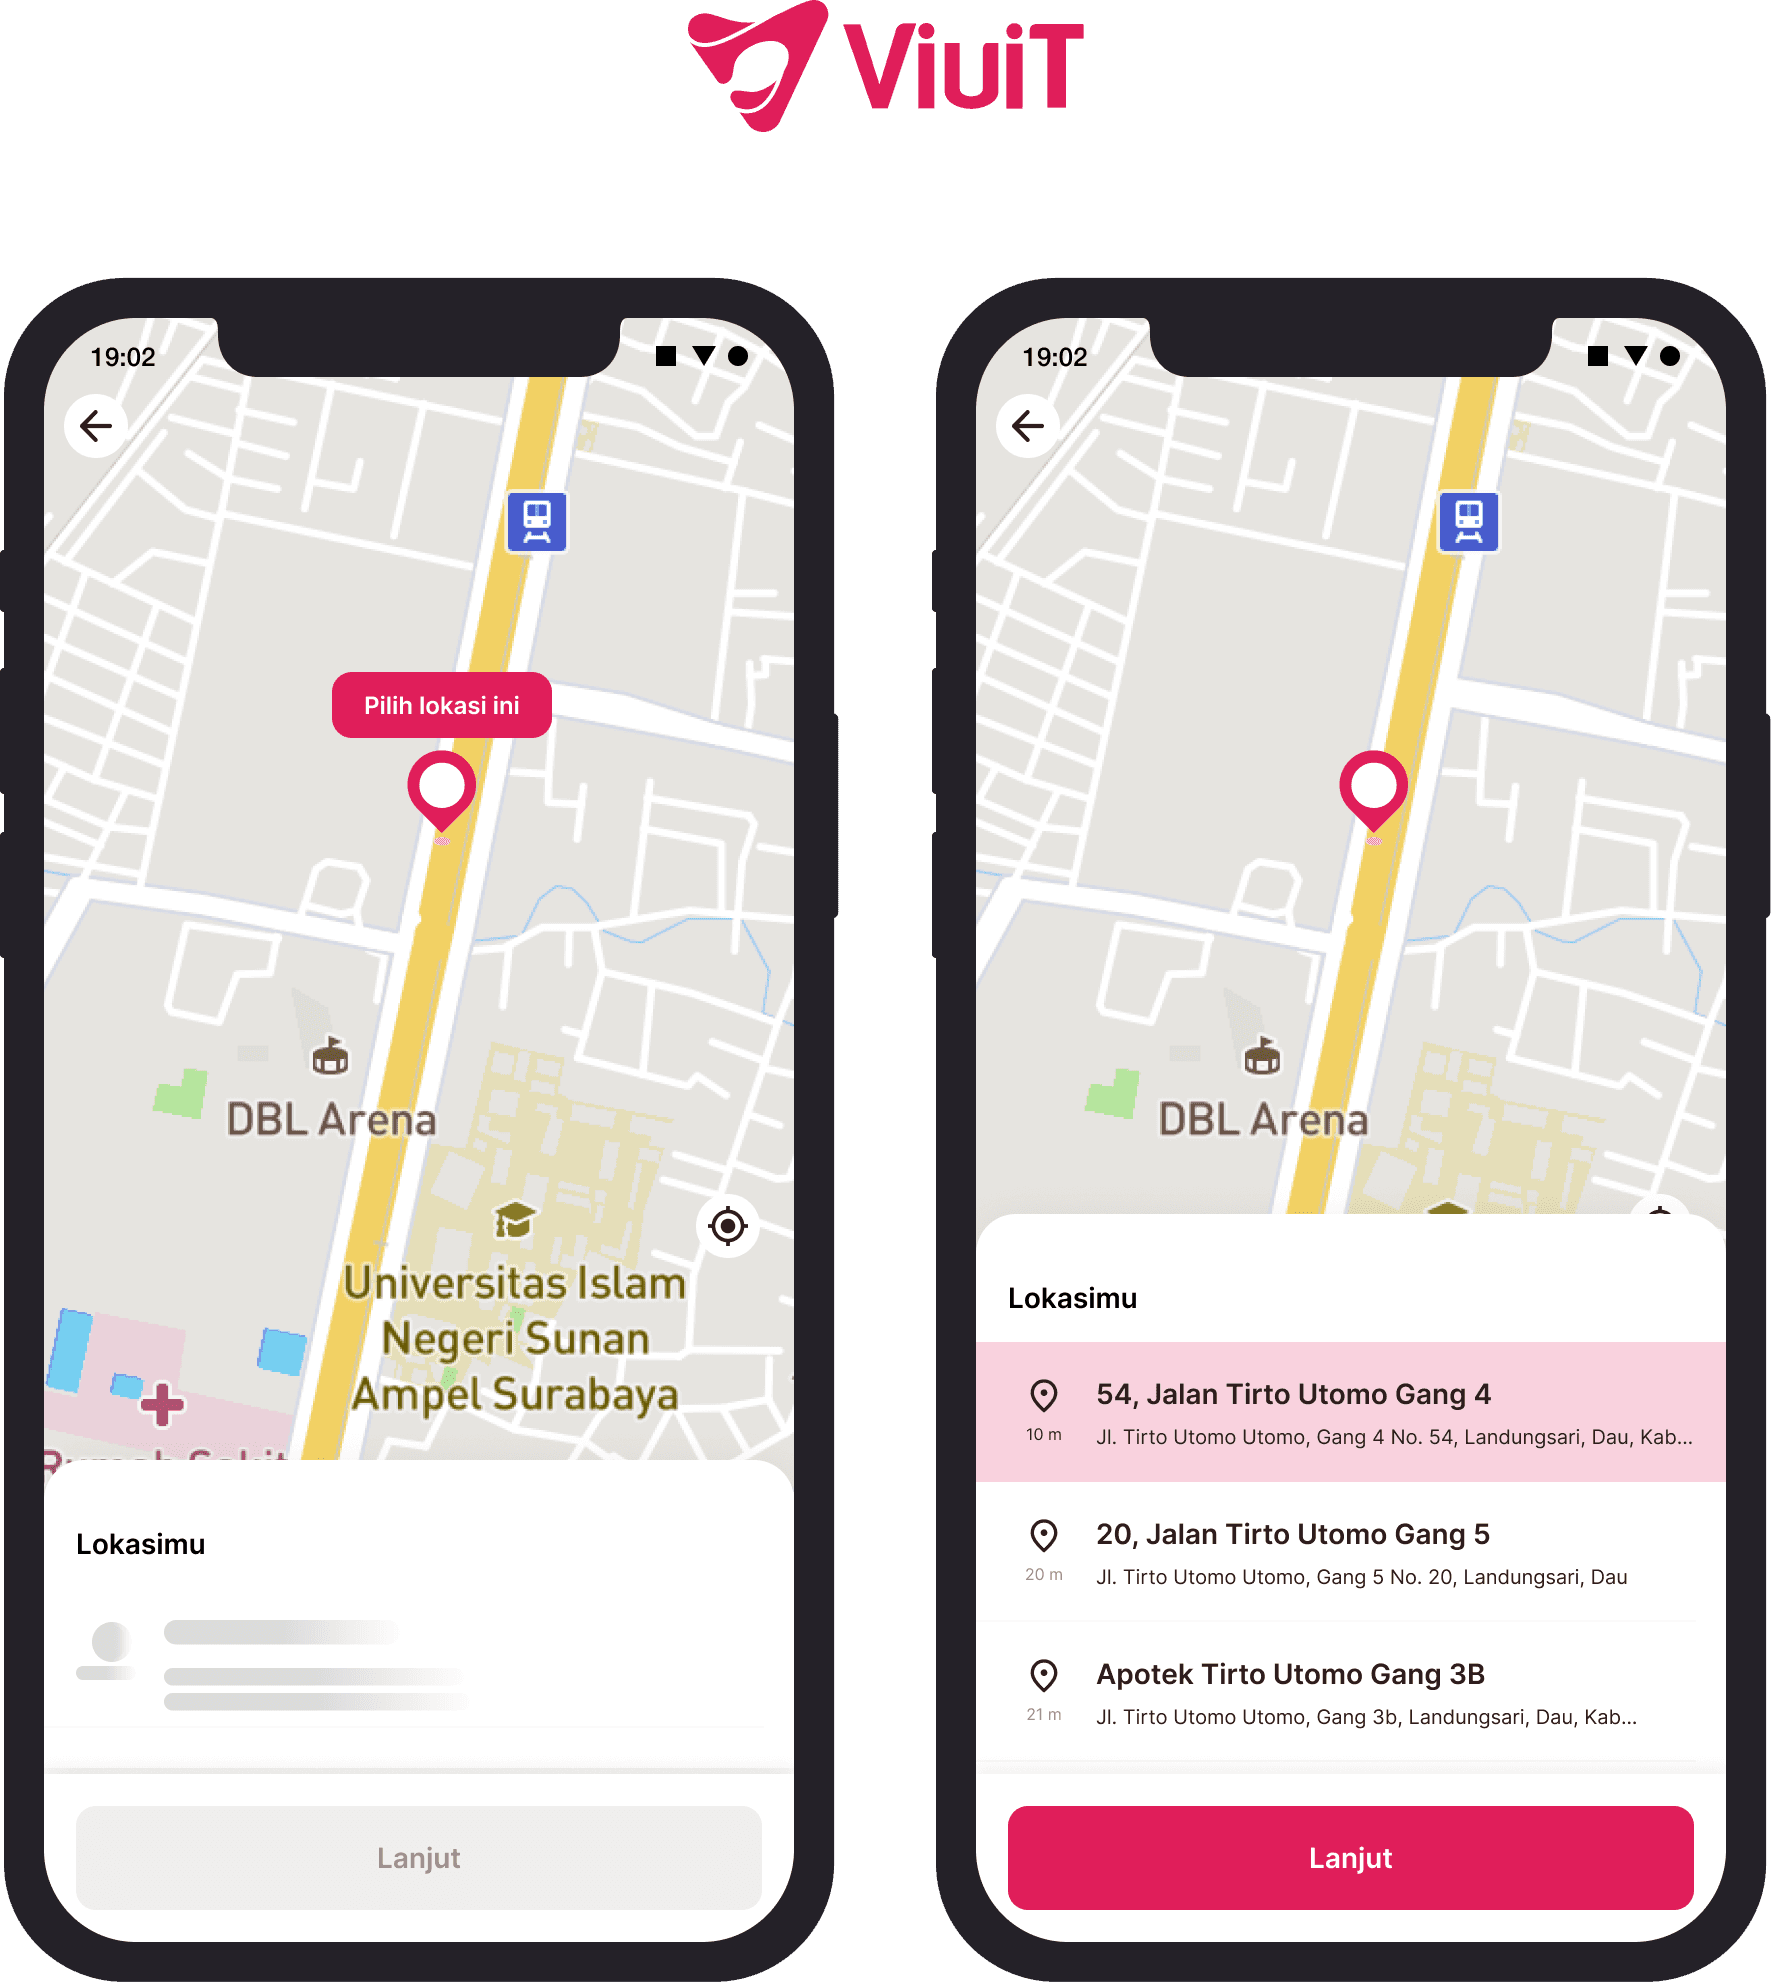
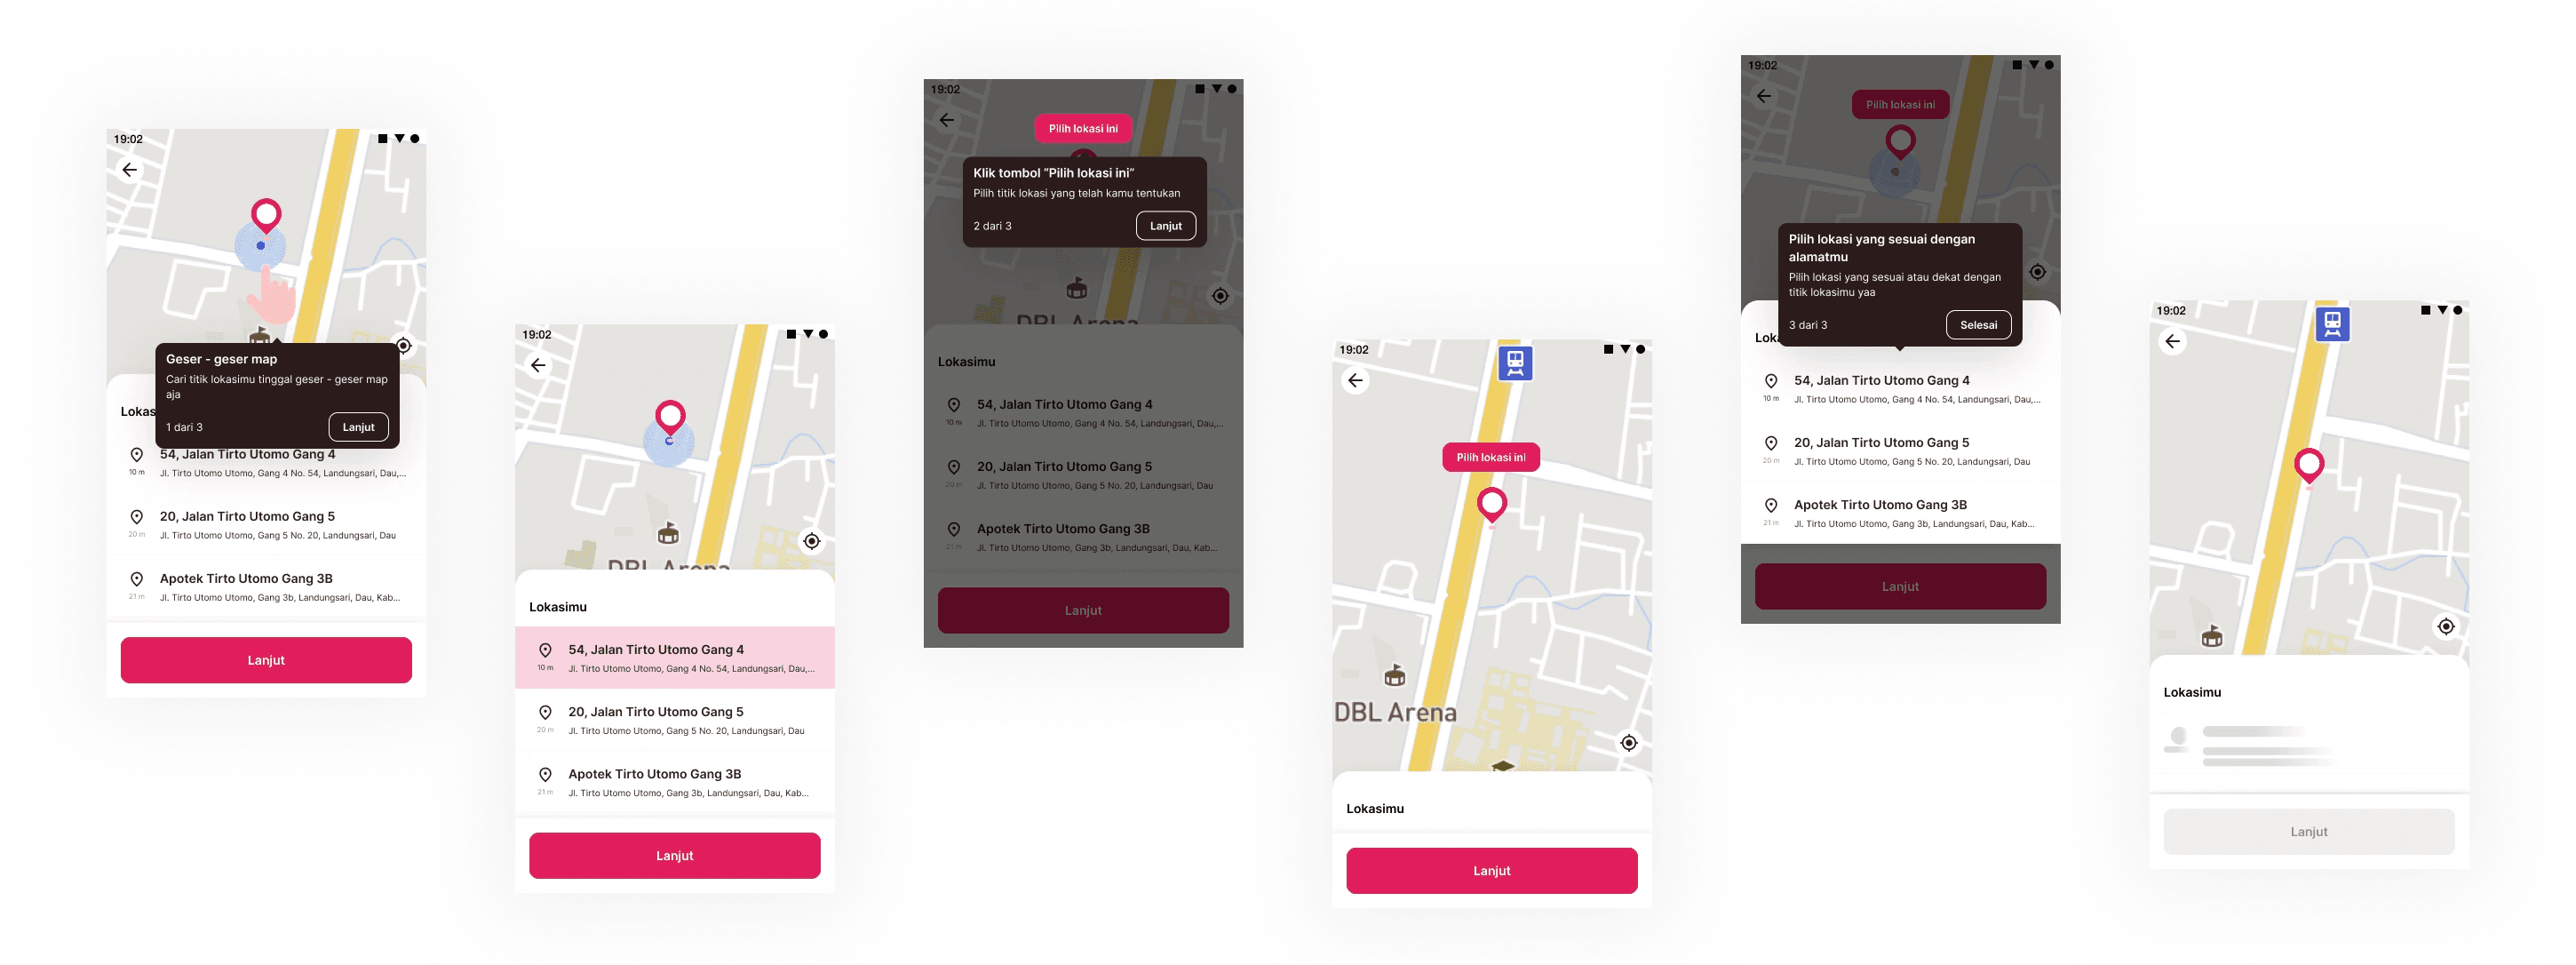
AFTER REVAMP : USER FLOW CHOOSE LOCATION ON MAP
Ideate and design for HMW 3


Google Analytics
Click Rate & Funnel UX Journey
Two months after launch to avoid user bias while learning new features and avoiding significant marketing program periods.
Click rate location
Expectation : Increase
Before Revamp
0.2%
8-14 May 2023
After Revamp
3.6%
16-22 August 2023
Expectation : Increase
Before Revamp
0.6%
8-14 May 2023
After Revamp
0.68%
16-22 August 2023
Expectation : Decrease
Before Revamp
56.41%
8-14 May 2023
After Revamp
14.08%
16-22 August 2023
Expectation : Decrease
Before Revamp
4
After Revamp
2
Retrospective
Integrate current quantitative and qualitative data
Integrating both quantitative and qualitative data significantly aids the research design process. Quantitative data identifies the issues that arise and evaluates test assumptions. Then, qualitative data assists in clarifying why the issues occur.
The importance of designers understand the boundaries in business and technology
In addition to the importance of having empathy for users, empathy is also needed for business and technology conditions, especially for startups that have just been established and have not yet made a profit. This aims to ensure the continuity of business costs efficiently.
In collecting analytical data, it is important to know the right time in order to avoid possible biases. For example, a promotional campaign that increase registration or sales processes can create bias. Furthermore, when users need to learn new features, this may lead to diverse biases. Therefore, it is very important to determine the time or conditions of the same comparison when tracking data before and after repair.


© Bariyatus DIyah Nurlaili. 2024